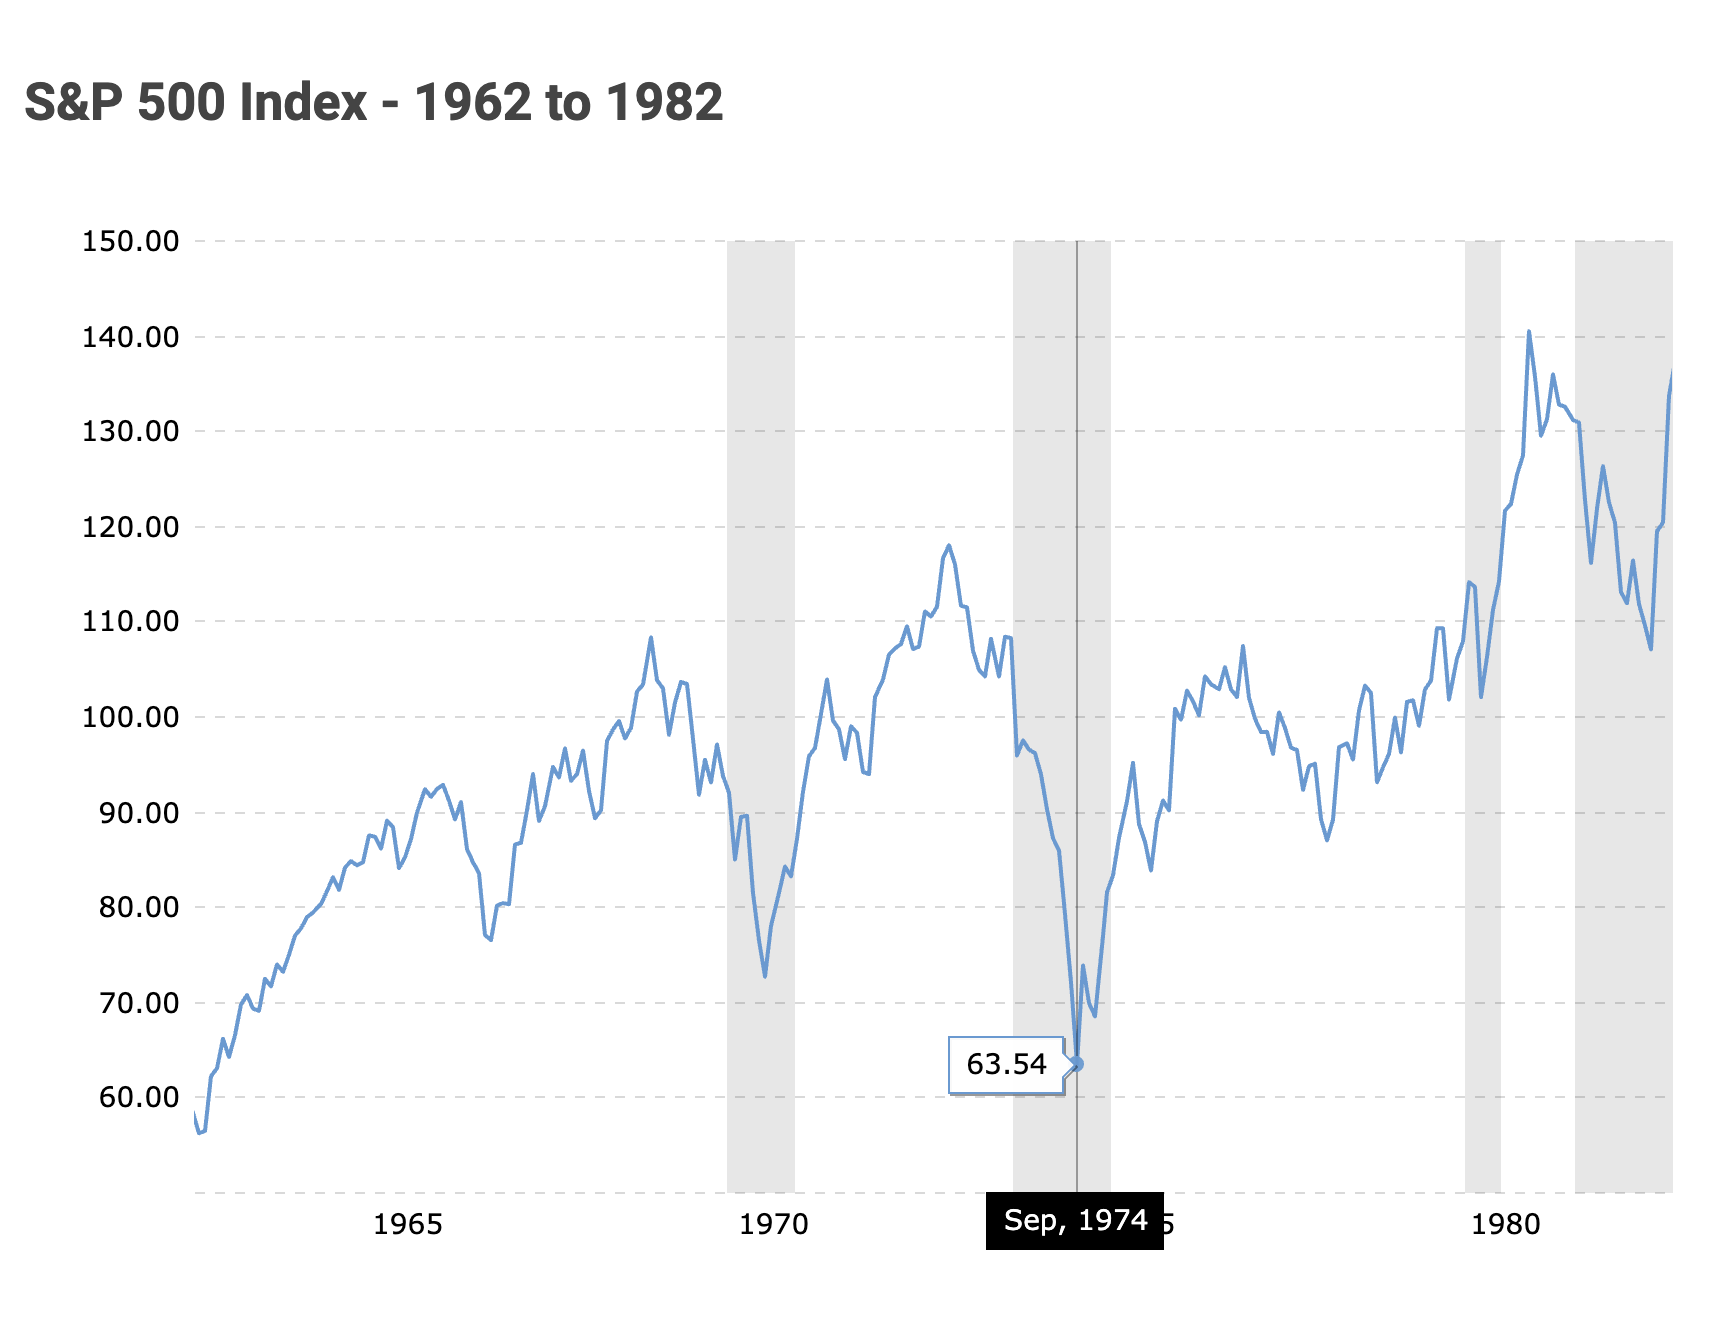
In his annual reports and shareholder meeting Q&A sessions, Warren Buffett often mentions a stand-out period from 1968 to 1979 where the US stock market was stuck in a “consolidation” pattern – it wasn’t flat, the market hit a high in 1968 and didn’t fully break out until after 1979. It included a 50% crash, bottoming in Sep 1974.
He has said that in 1969 he couldn’t find any stocks trading at bargains (he even closed down his investing partnership and returned funds to investors), but in 1974 he was giddy about all the bargains and was buying with both hands.
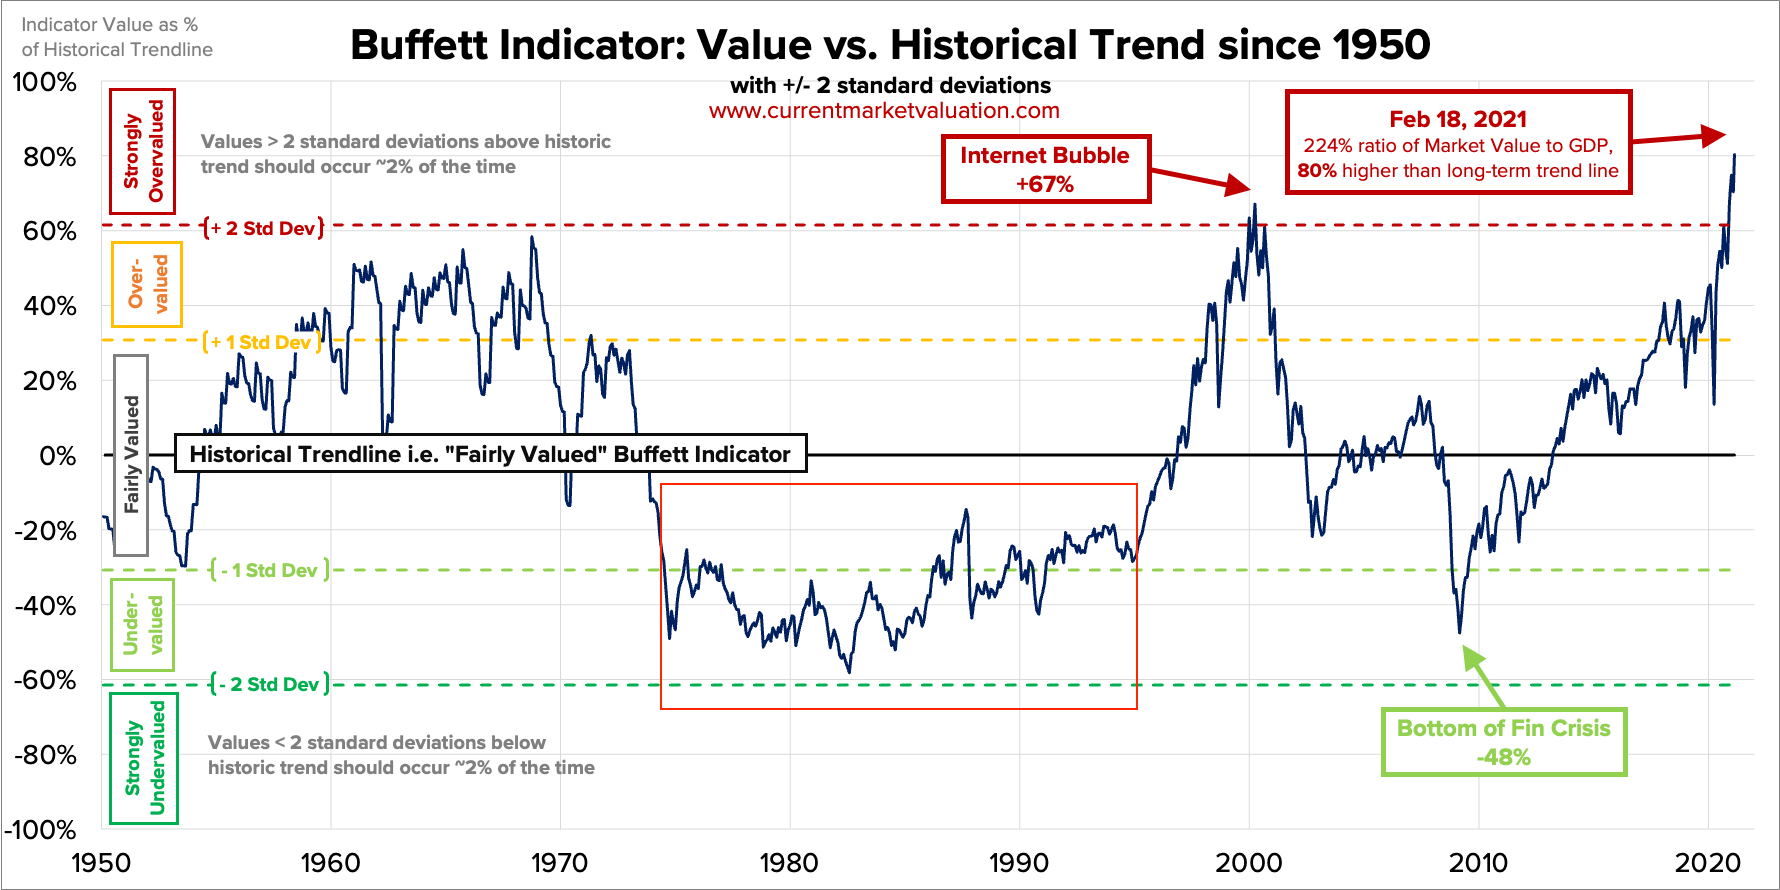
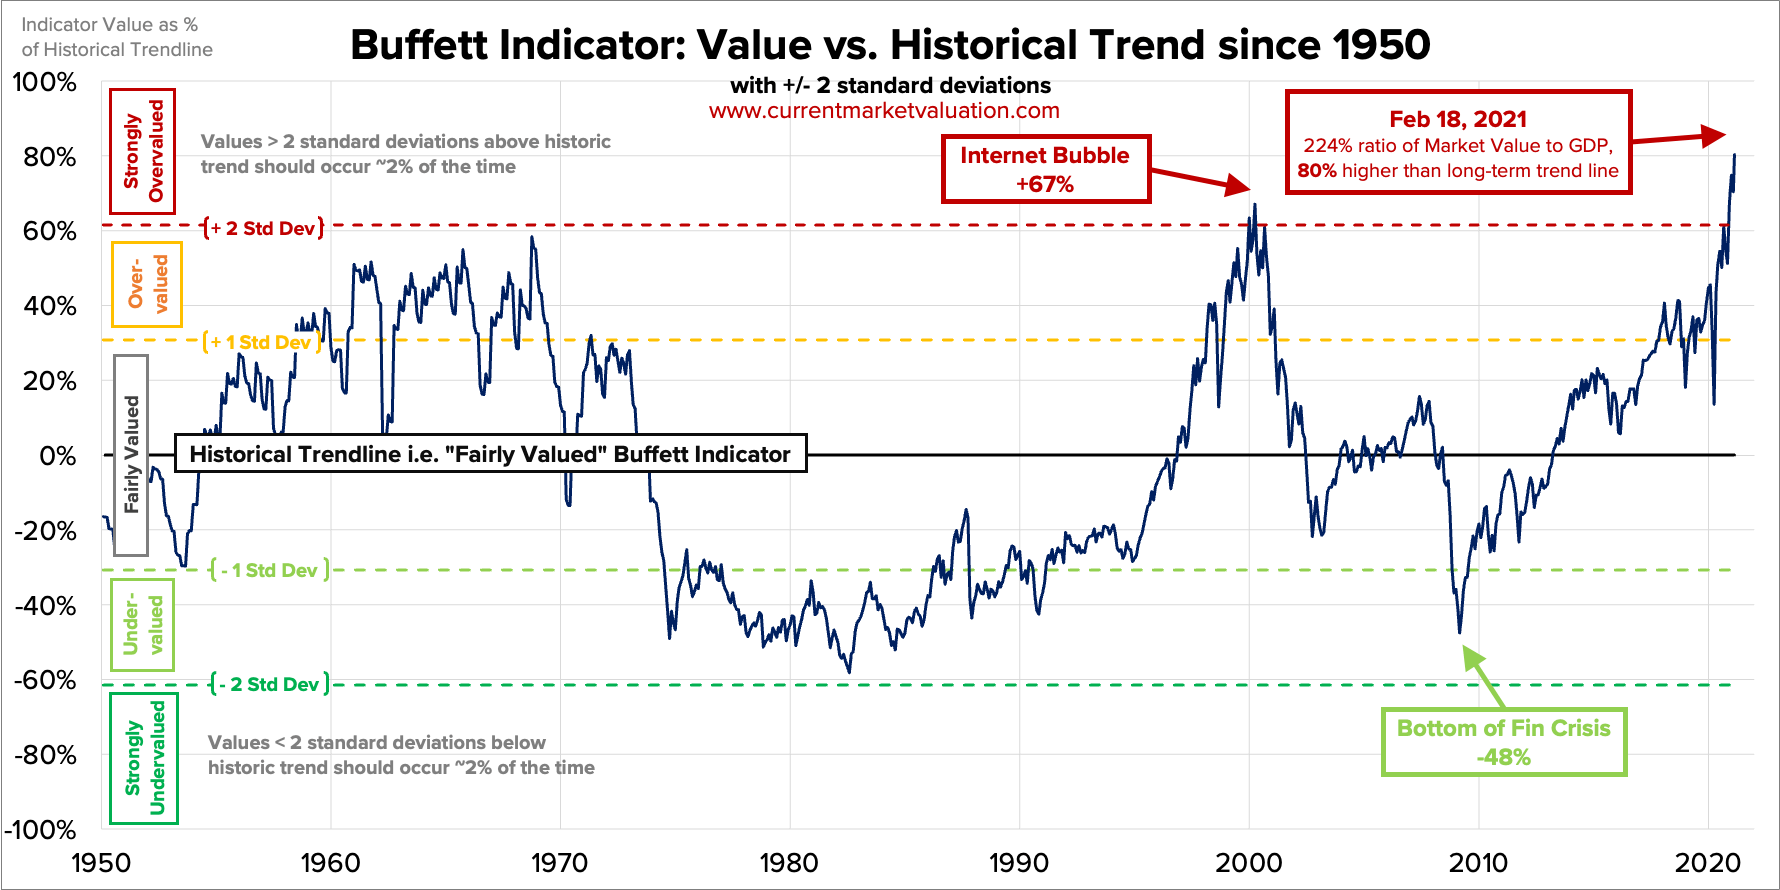
Looking at the Buffett Indicator you can see the 20 year period from 1974 to 1994 was an incredible period to have been accumulating stocks at decent valuations.
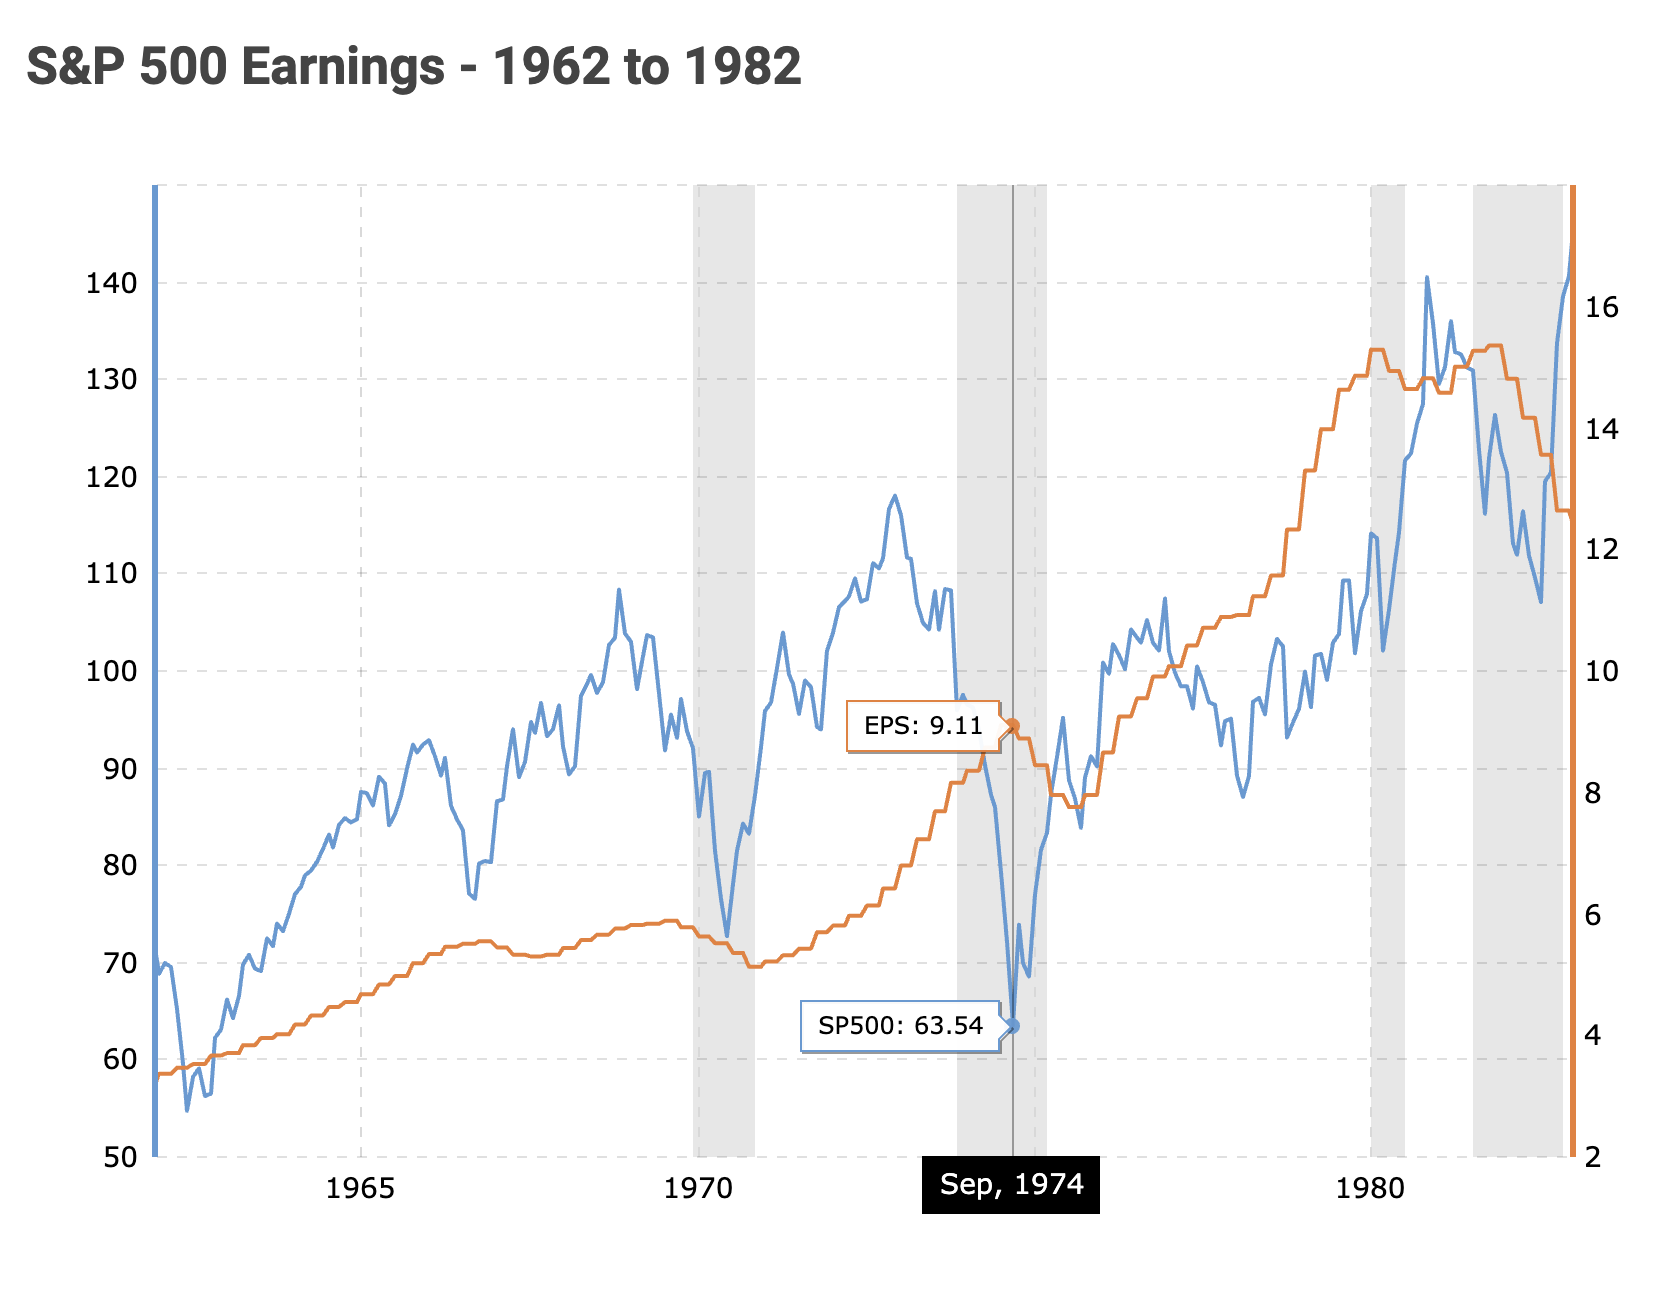
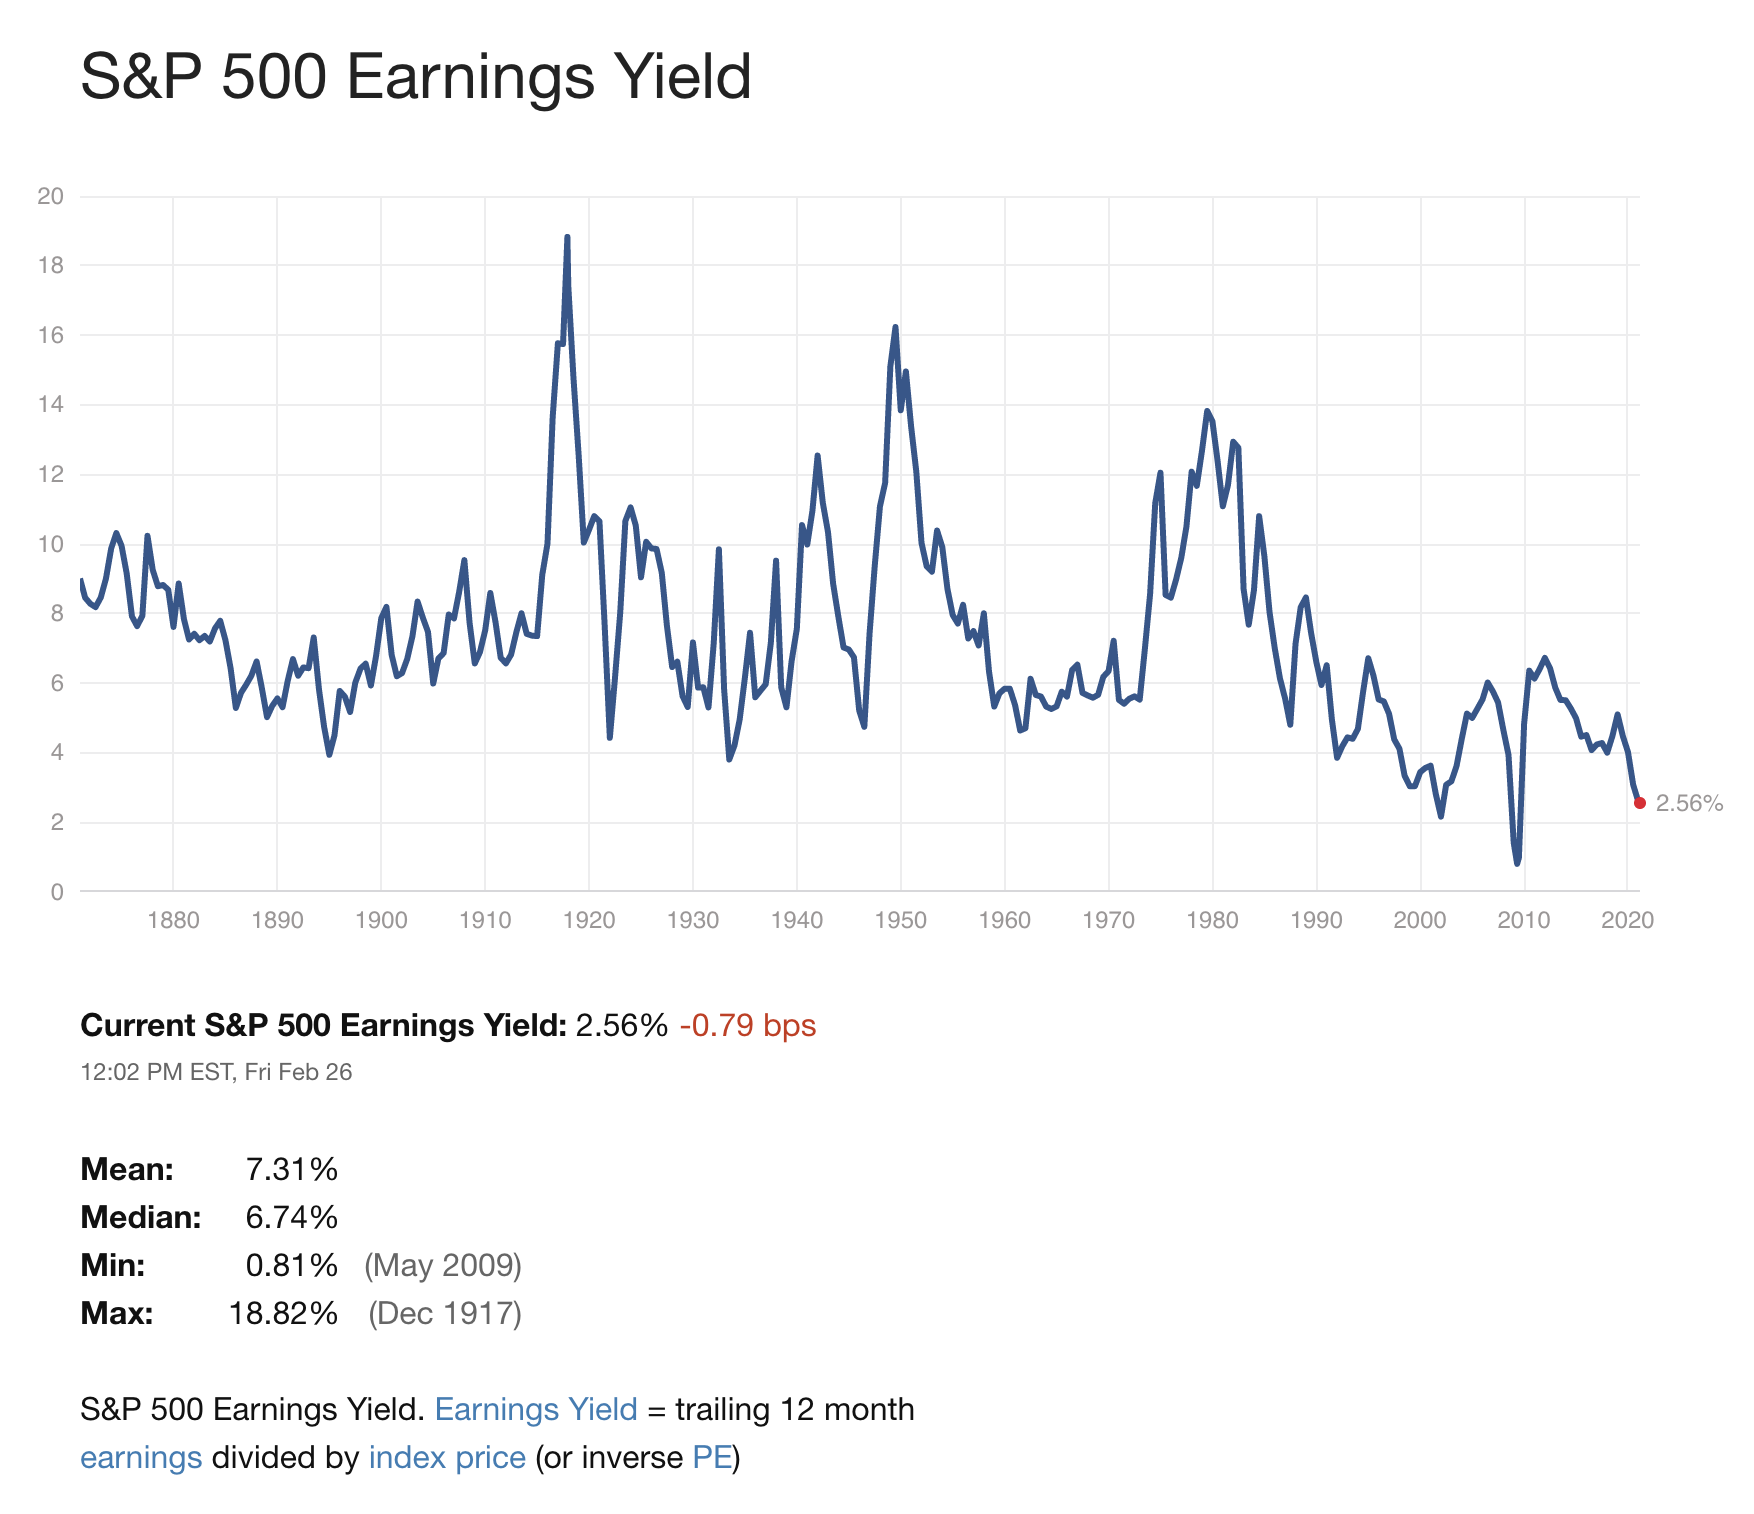
Zooming back in on Sep 1974 you can see earnings had been rising after the recession in 1970 from an EPS of about 5.0 to 9.11, while the S&P 500 fell nearly 50% from 1972 to 1974.
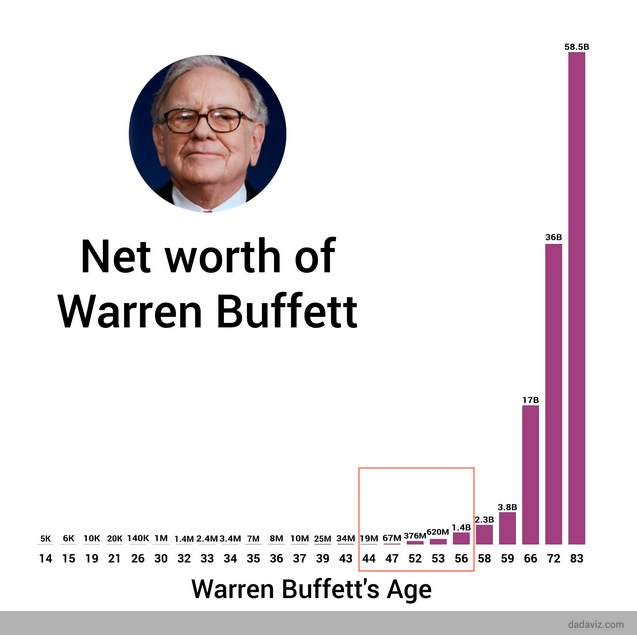
Warren Buffett’s Net Worth by Age
Buffett’s net worth drops from $34 million in 1973 (at age 43) to $19 million in 1974 (age 44), but he absolutely crushes it from age 44 to age 56 (just 12 years). Taking that $19 million up to $1.4 billion and far beyond.
I came across this really interesting Forbes interview with Buffett in 1974 that sums up his feelings at the time, finally finding bargains again, saying he was “like an oversexed guy in a harem. This is the time to start investing”.
An exerpt:
Warren Buffett doesn’t talk much, but when he does it’s well worth listening to. His sense of timing has been remarkable. Five years ago, late in 1969, when he was 39, he called it quits on the market. He liquidated his money management pool, Buffett Partnership, Ltd., and gave his clients their money back. Before that, in good years and bad, he had been beating the averages, making the partnership grow at a compounded annual rate of 30% before fees between 1957 and 1969.
He quit essentially because he found the game no longer worth playing. Multiples on good stocks were sky-high, the go-go boys were “performing” and the list was so picked over that the kind of solid bargains that Buffett likes were not to be had. He told his clients that they might do better in tax-exempt bonds than in playing the market. “When I got started,” he says, “the bargains were flowing like the Johnstown flood; by 1969 it was like a leaky toilet in Altoona.” Pretty cagey, this Buffett. When all the sharp MBAs were crowding into the investment business, Buffett was quietly walking away.
Buffett settled back to manage the business interests he had acquired, including Berkshire Hathaway, a diversified banking and insurance company. The businesses did well.
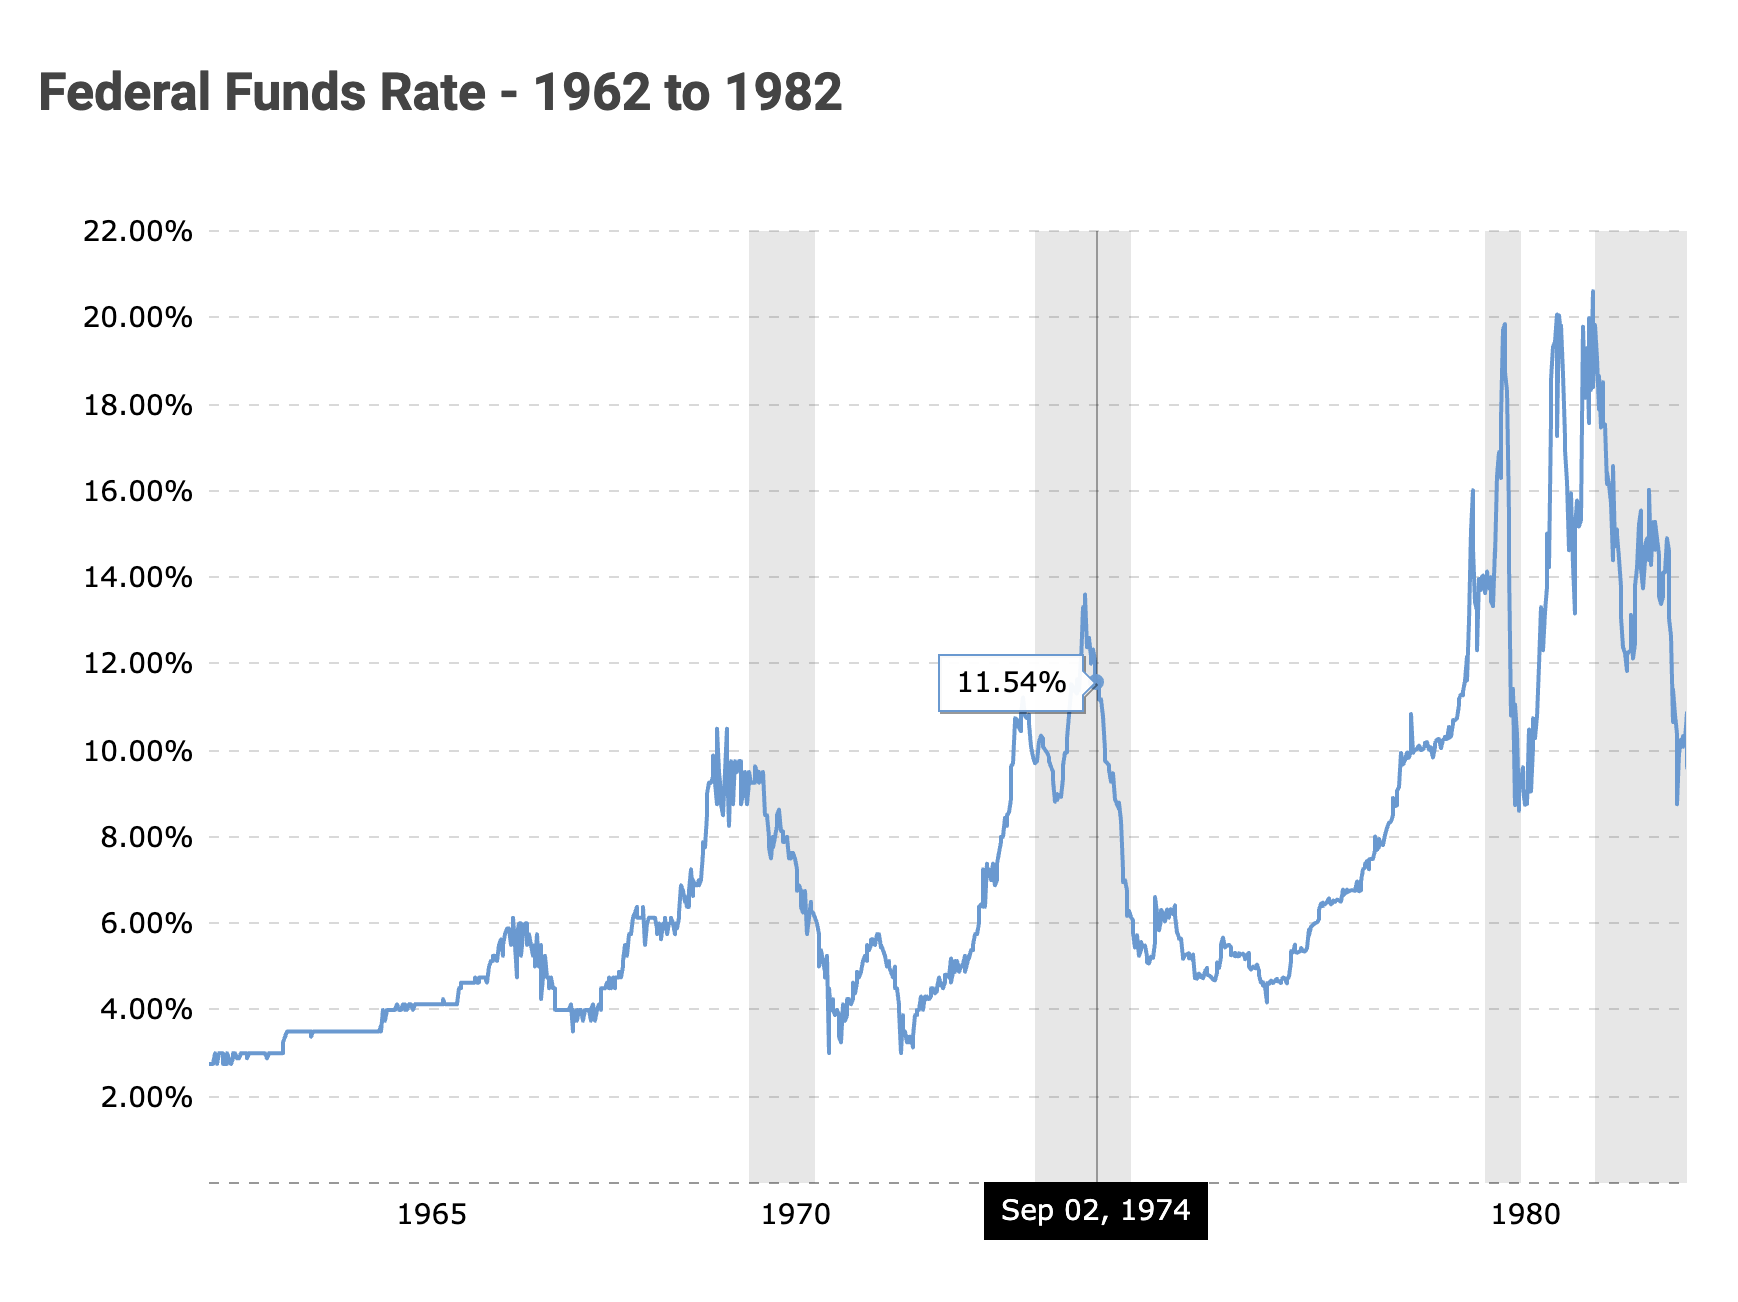
Stagflation: Stagnant Economic Growth, High Interest Rates, and High Inflation
Putting more context around that time period – during the late ’70s the US saw skyrocketing interest rates:
…and skyrocketing inflation…
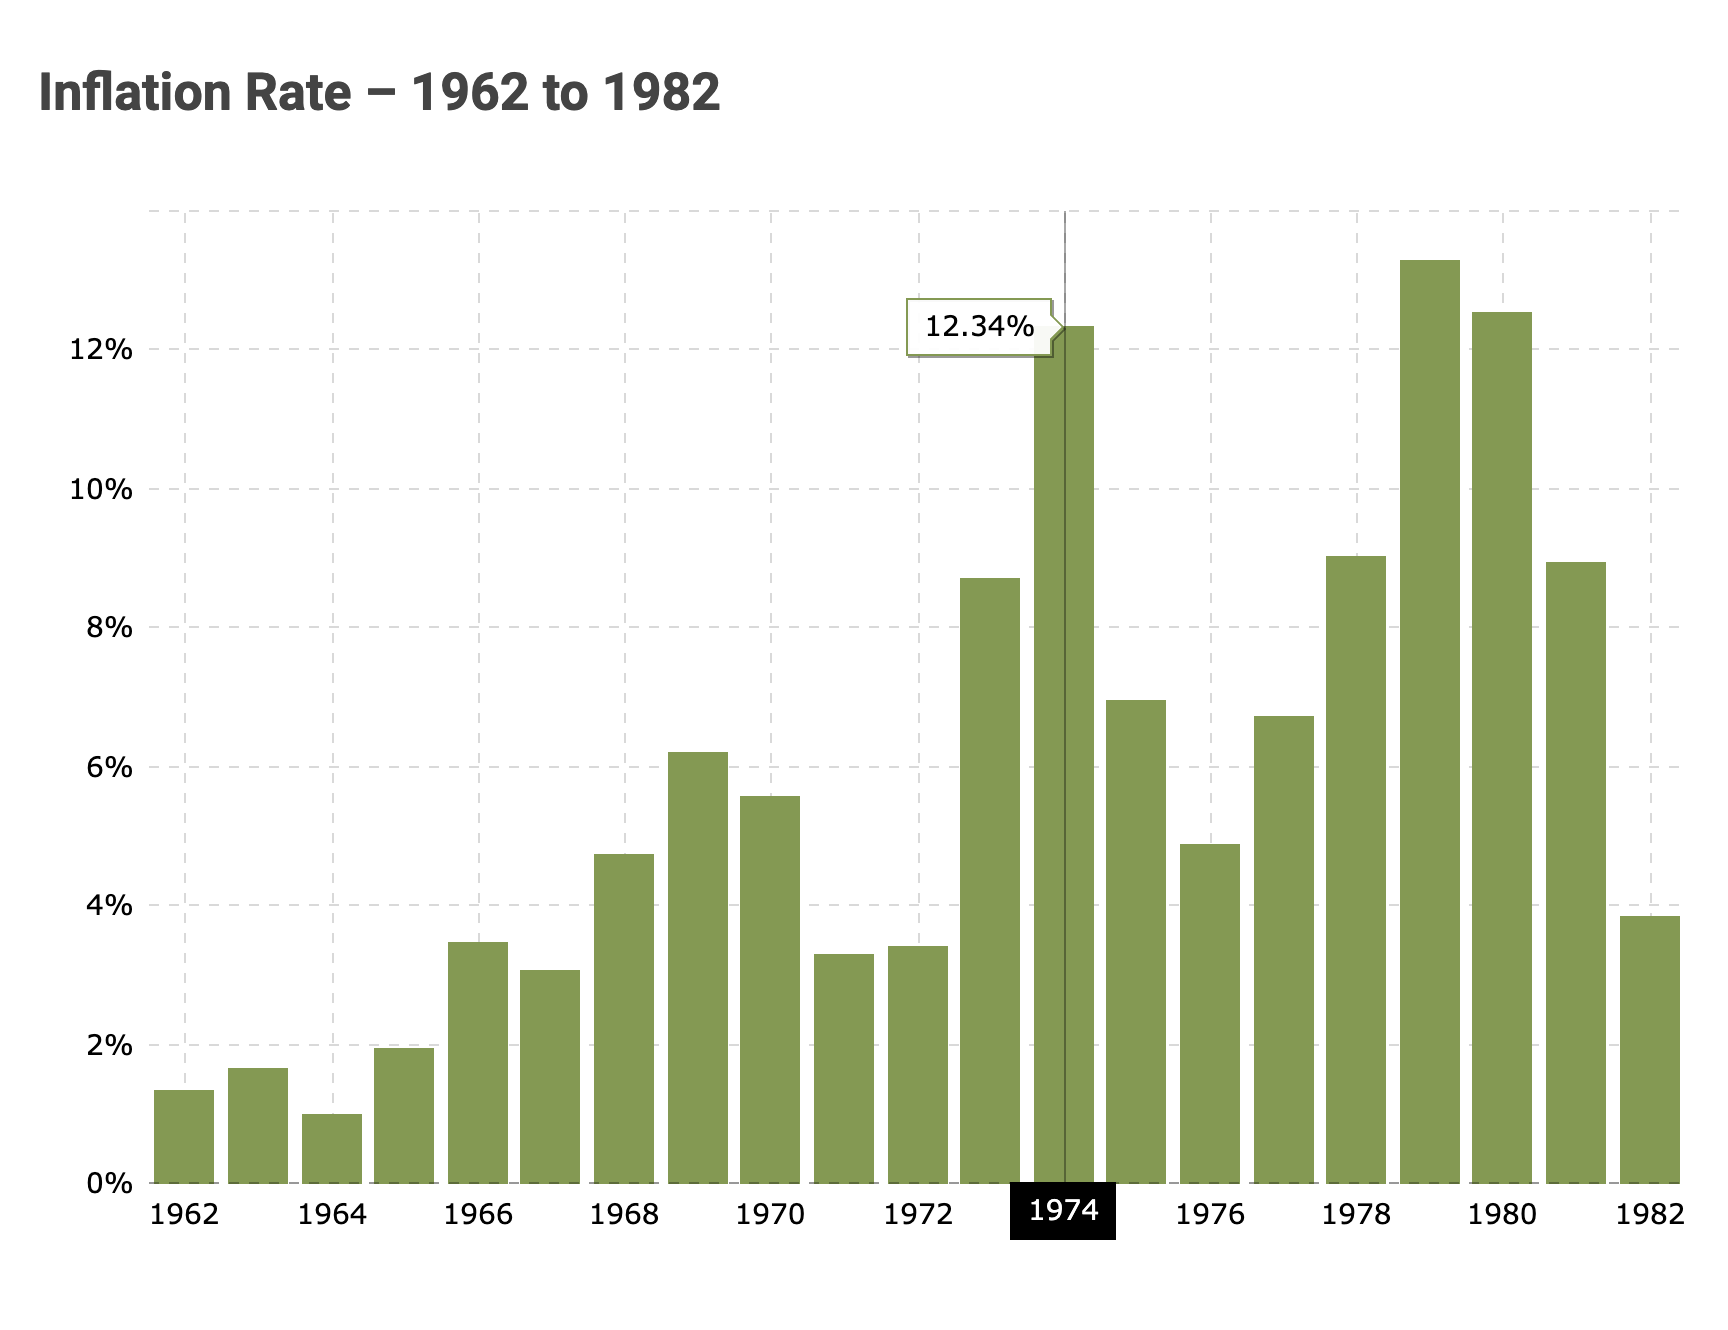
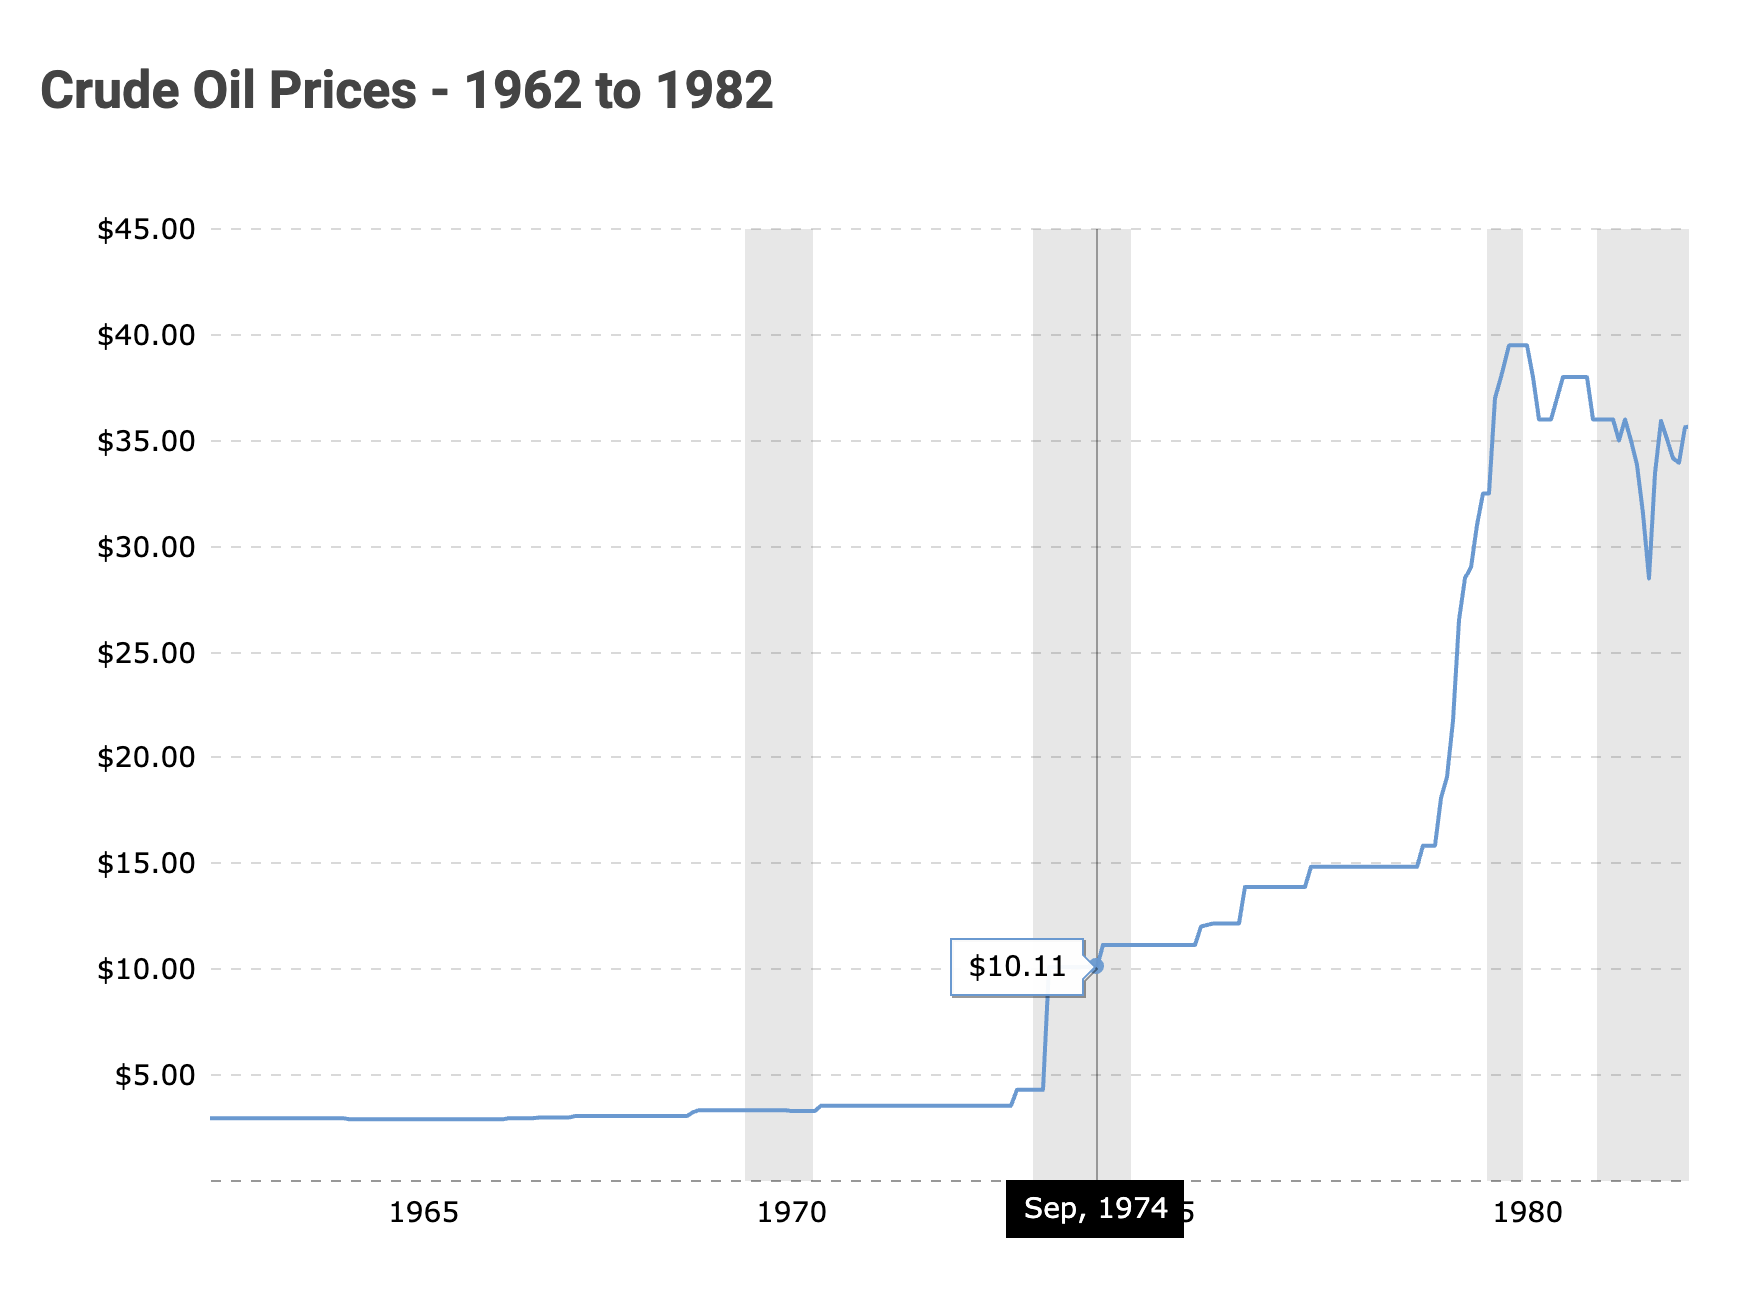
… inflation seems to have been primarily in commodities, most famously crude oil…
1971: End of the Gold Standard
As the U.S. economy prospered after World War II the US dollar became the world’s reserve currency as many countries fixed their exchange rates relative to the U.S. dollar and central banks could exchange dollar holdings into gold at the official exchange rate of $35 per ounce.
Americans bought more imported goods and paid in dollars. This large balance of payments deficit worried foreign governments that the United States would print more and no longer back up the dollar in gold.
The Soviet Union had become a large oil producer. It was accumulating U.S. dollars in its foreign reserves (since oil is priced in dollars) and feared the United States would seize its bank accounts as a tactic in the Cold War. The Soviet Union deposited its dollar reserves in European banks, and these became known as eurodollars.
By the 1970s, the United States stockpile of gold continued to decline as President Nixon’s economic policies led to stagflation (stagnant economic growth, high unemployment, and high inflation). Double-digit inflation reduced the eurodollar’s value, and more and more banks started redeeming their holdings for gold. The United States could no longer meet this growing obligation.
This, along with the fiscal strain of federal expenditures for the Vietnam War and persistent balance of payments deficits, led U.S. President Richard Nixon to end international convertibility of the U.S. dollar to gold on August 15, 1971 (the “Nixon Shock”).
Nixon no longer allowed the Fed to redeem dollars with gold, which made the gold standard meaningless. The U.S. government repriced gold to $38 then to $42 per ounce in 1973 and then decoupled the value of the dollar from gold altogether in 1976.
But the bottom line was: the US could now create dollars without having to peg them to a gold reserve.
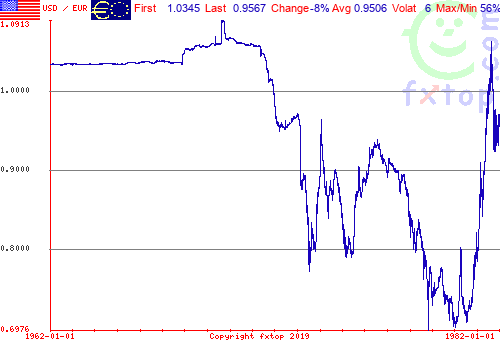
The US dollar collapsed from 1971 to 1980 (but rebounded significantly in the 1980s):
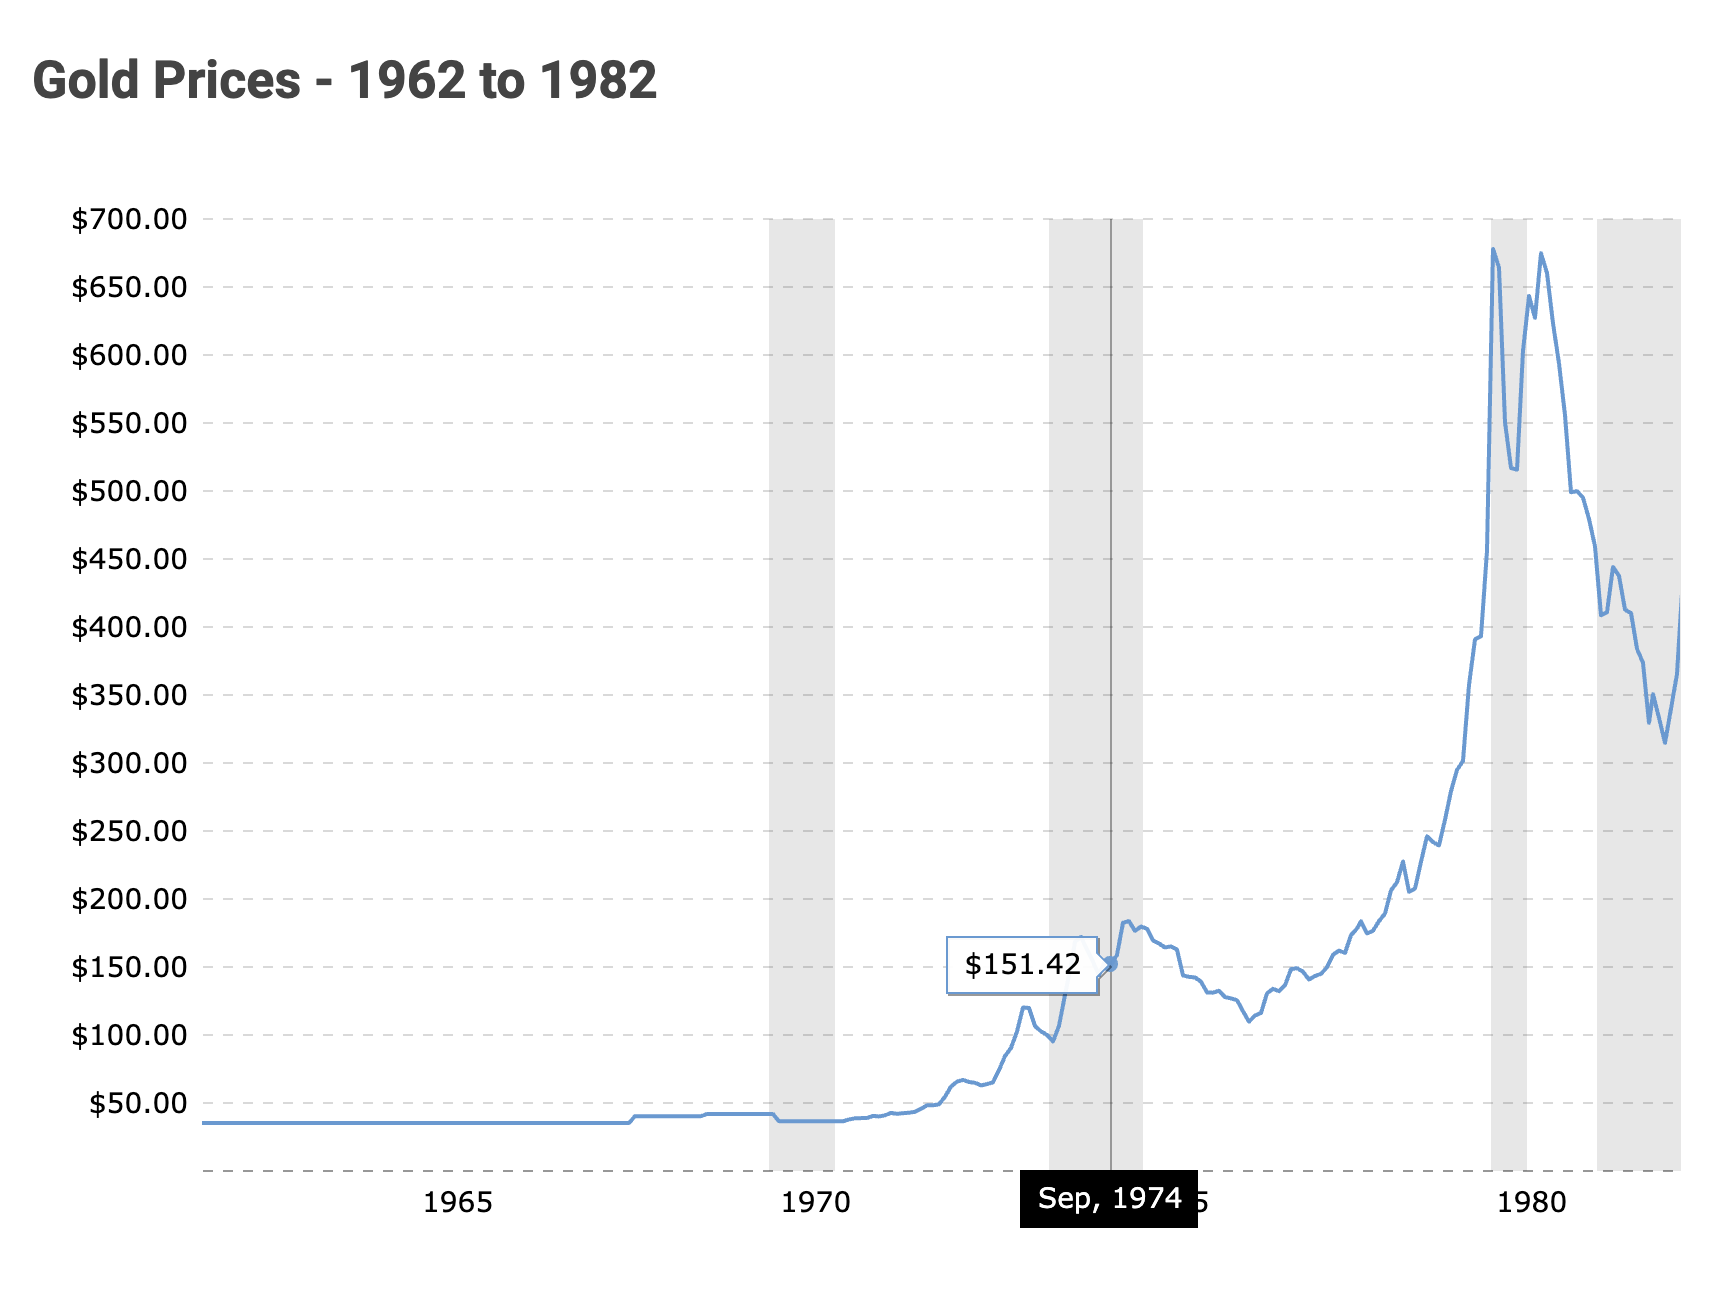
The price of gold and other commodities shot higher over the same period:
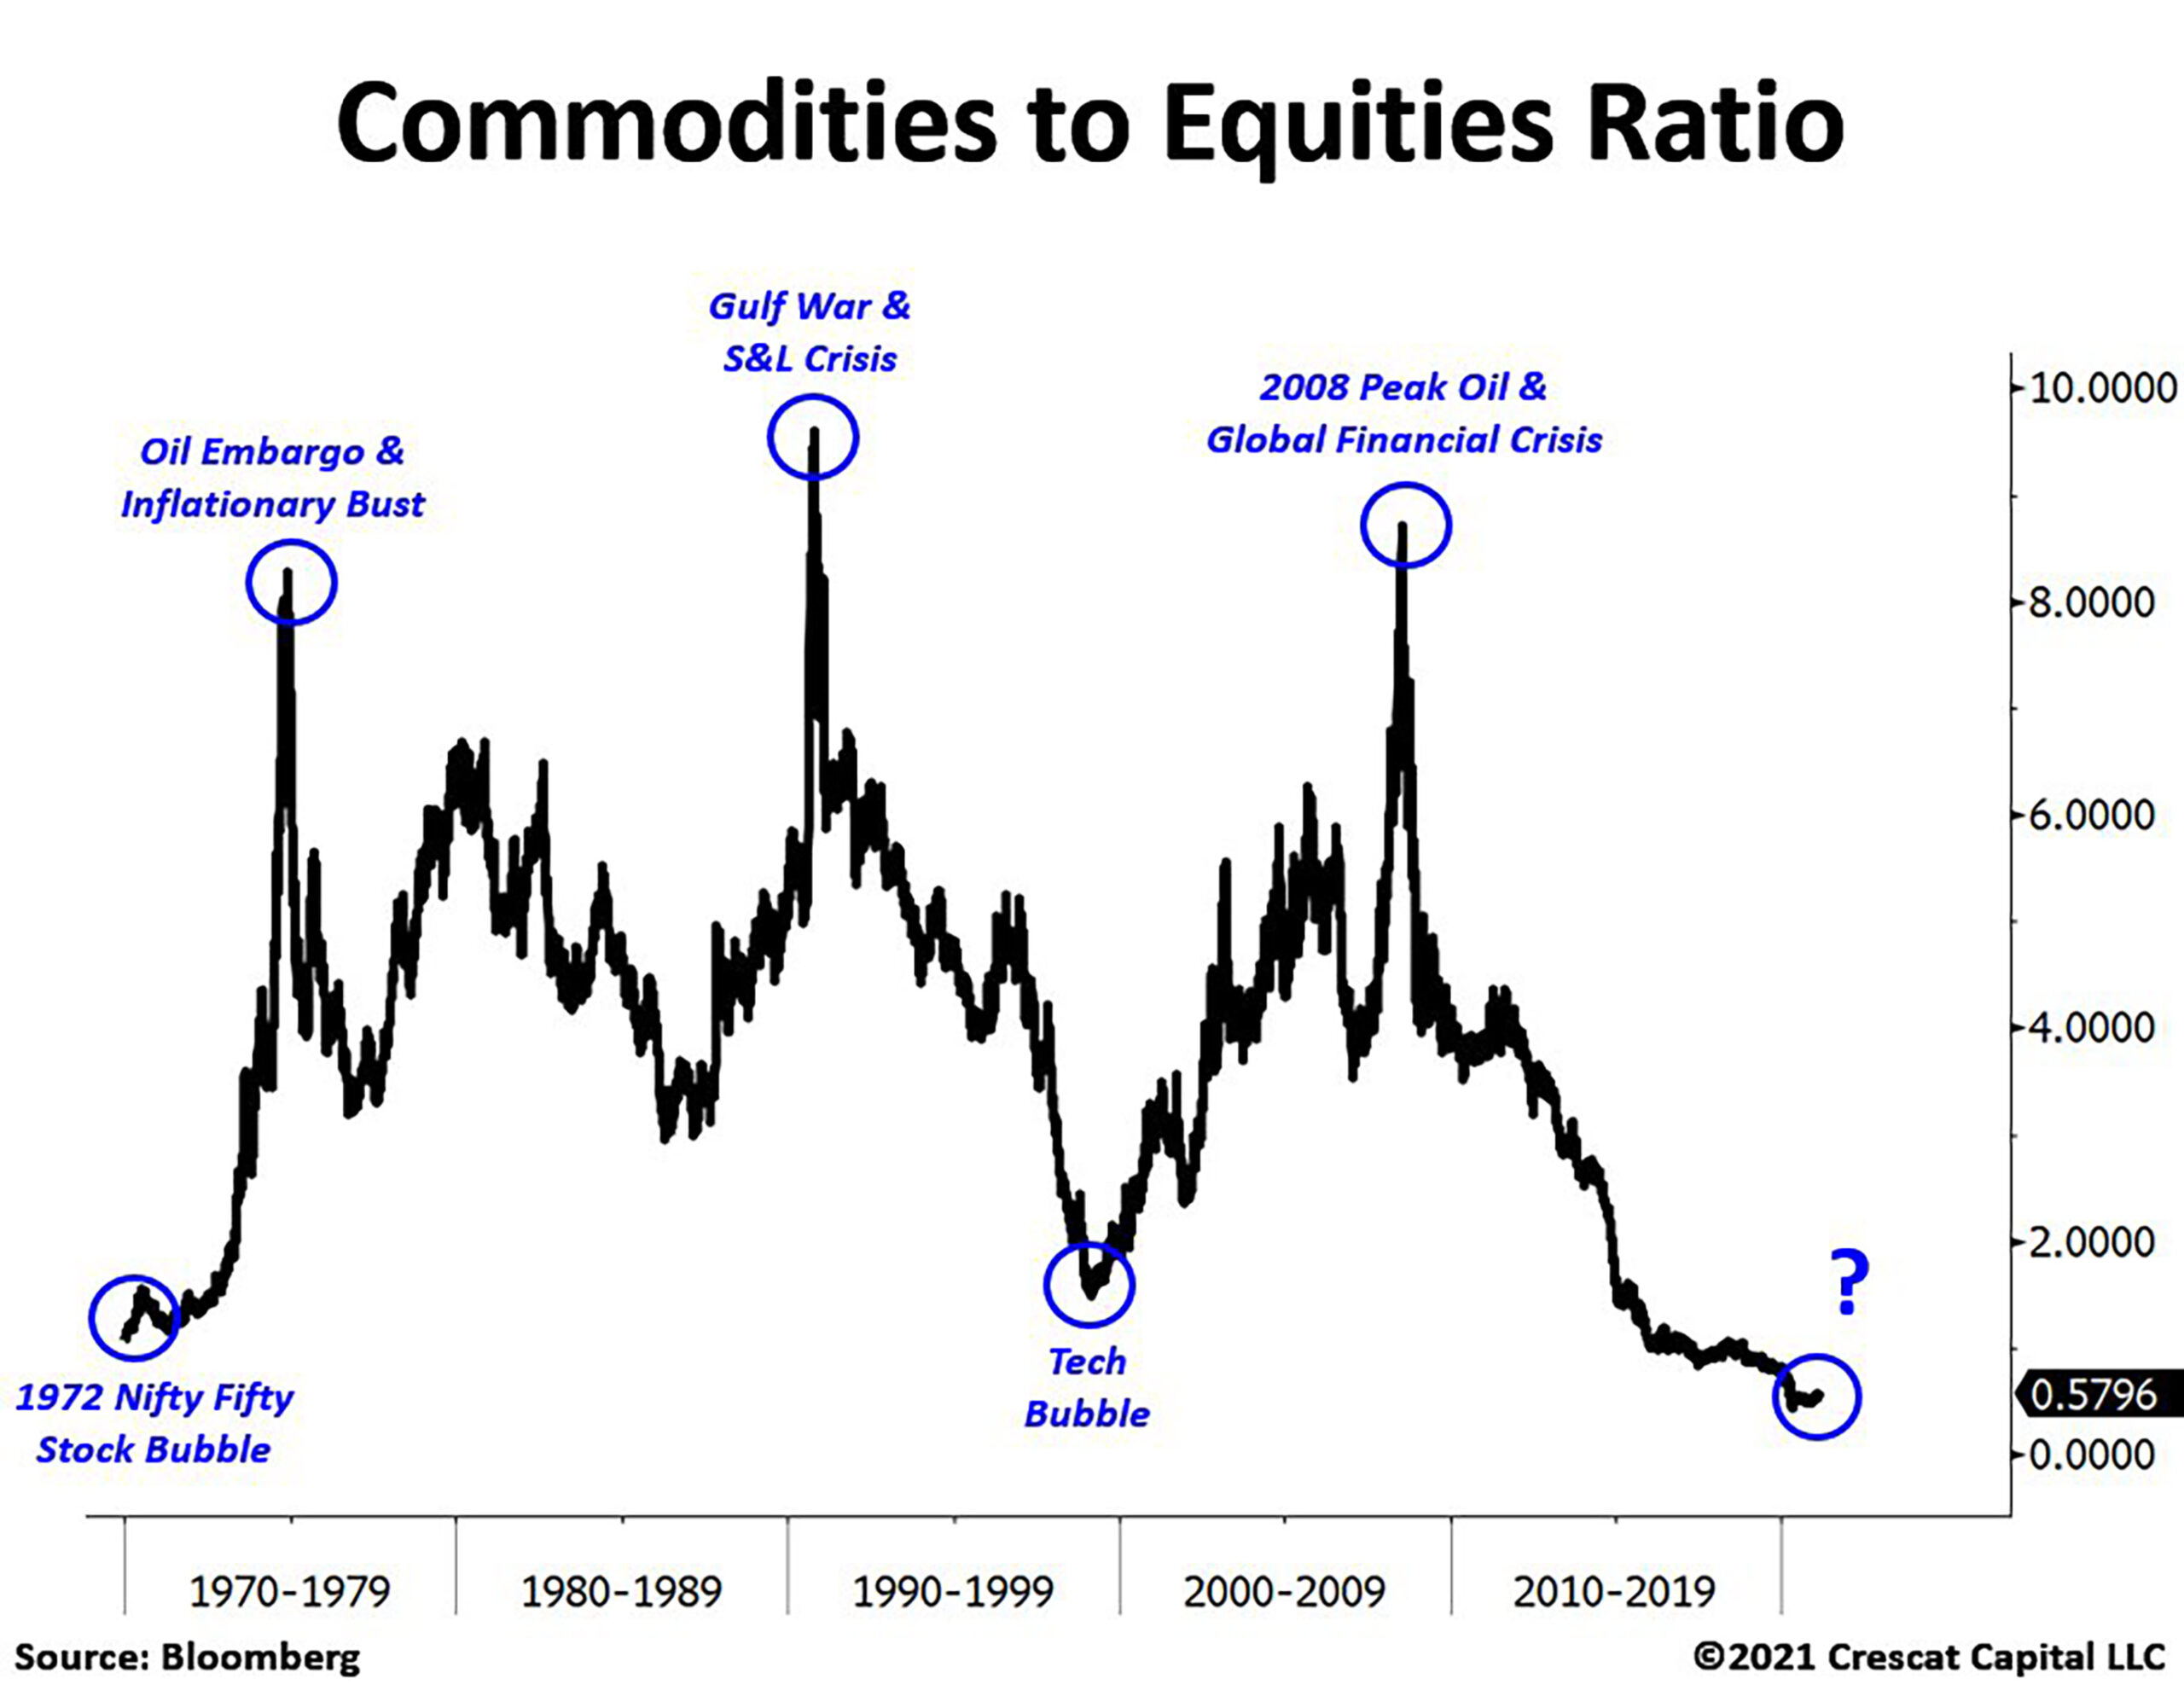
Commodities ↑ and Stocks ↓
Back to the stock market. It was not participating in the inflationary run-up until around 1979-1980, when the market then broke out again to new highs and commodities crashed back down to earth.
An interesting period in US history and interesting (to me) to read that Forbes interview where Warren had thrown up his hands in frustration in 1969, but was accumulating aggressively again by 1974.
How does today compare to 1969?
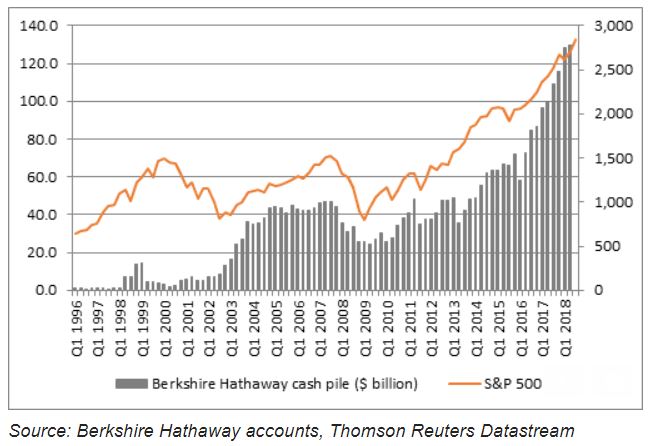
Looking at Berkshire Hathaway’s cash position from 1996 to 2018 (the only decent chart I could find), and listening to the Berkshire Shareholder Meetings, and looking at the Buffett Indicator, you can see 2015 to 2021 has been a period where Buffett and Munger are increasingly having trouble finding reasonably priced stocks, similar to what they experienced in 1969, and in 1999 (back then that was a big cash pile), and in 2005-2007, the lead-up to the GFC (Great Financial Crisis).
Berkshire’s cash pile is over $145 billion.
By taking a look again at the Buffett Indicator it’s clear Buffett can’t find many things to buy these days as stocks continue to scream higher, despite worsening fundamentals for many companies as a result of the pandemic.
Warren is now 90 years old and his colleague Charlie Munger is now 97 years old. I hope we get to see another period of consolidation in the stock market where there are more bargains to be found. And I hope Warren and Charlie get one more go at it.
(In 2006, Buffett made a commitment to gradually give all of his Berkshire Hathaway stock to philanthropic foundations.)
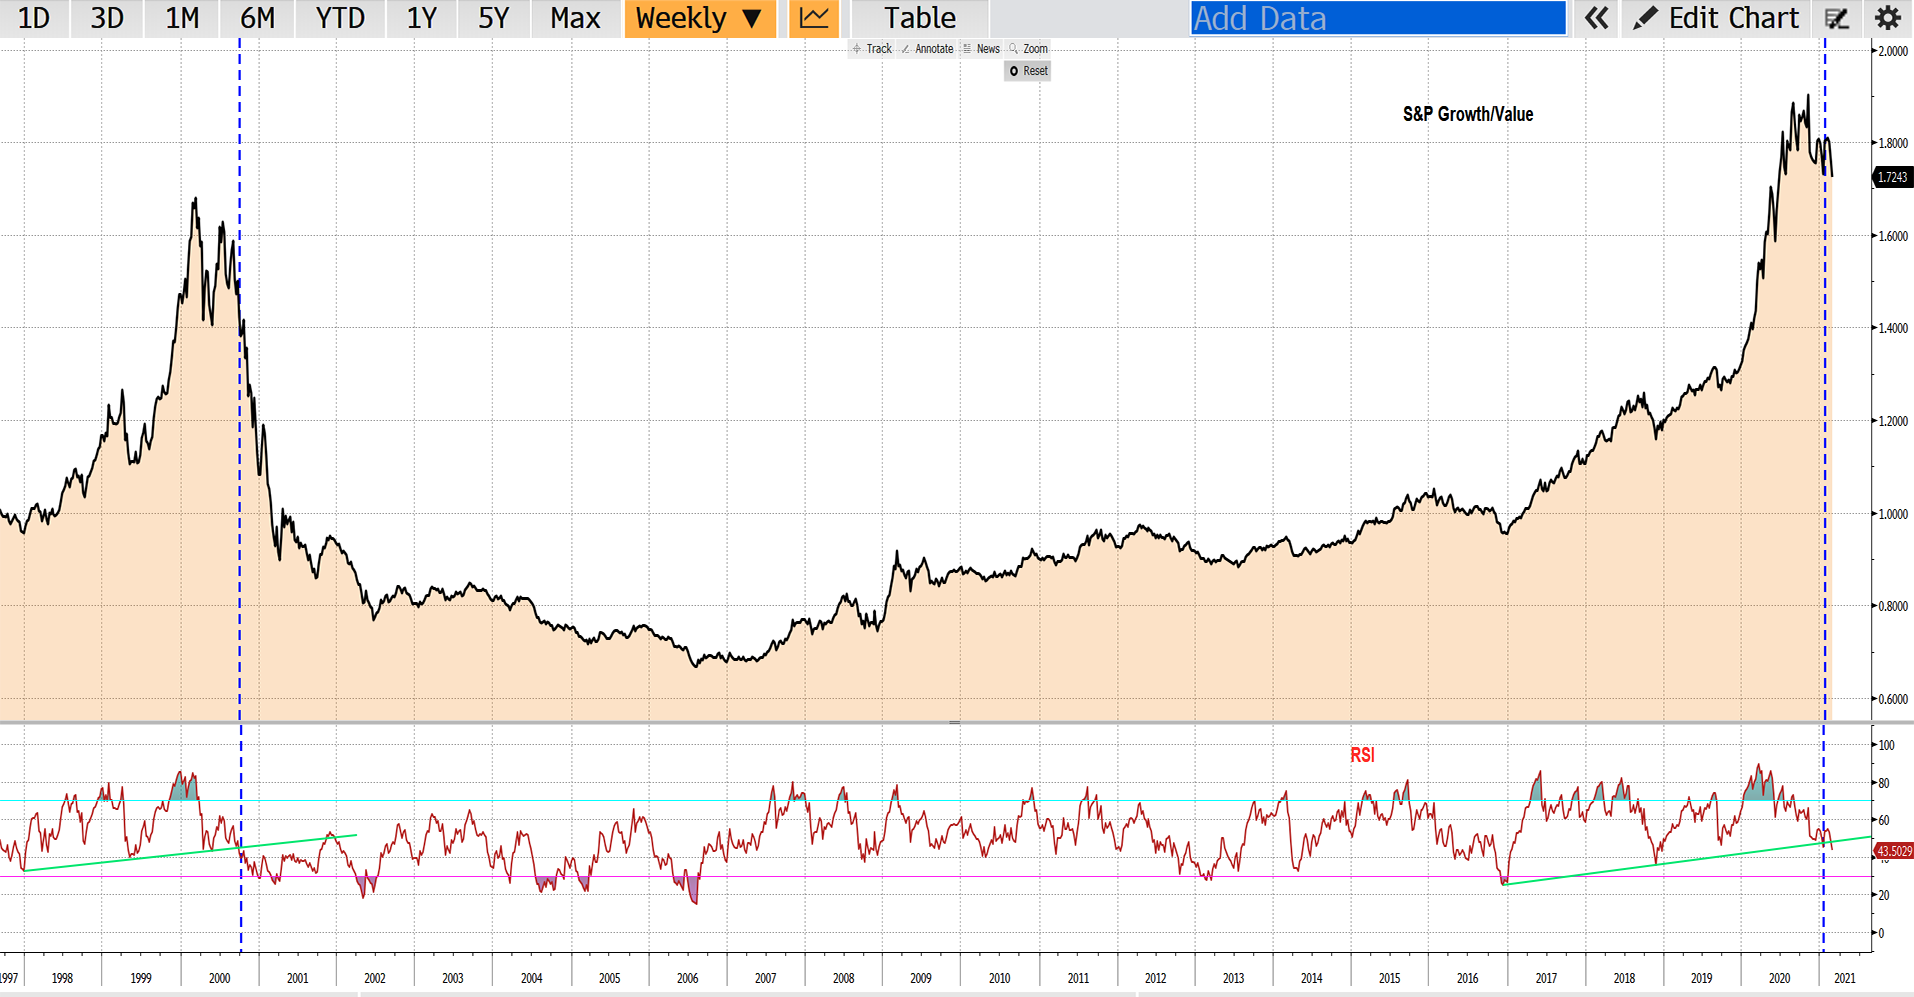
Growth/Value Ratio – 1997 to 2021 (24 years)
This has been the largest performance gap between growth and value funds on record, according to Morningstar.
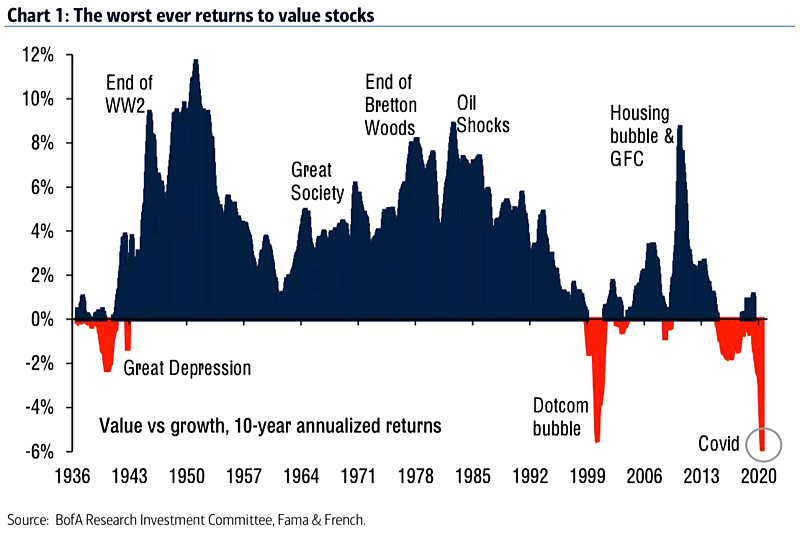
The bottom line? Buffett and Munger have said it many times… they were very fortunate to have been committed to value investing during the 1960, 1970s, 1980s when the 10-year annualized returns of value investing outperformed so strongly. After a long outperformance by growth investing, could we get another prolonged period of value outperformance?
Value/Growth Ratio – 1936 to 2020 (84 years)
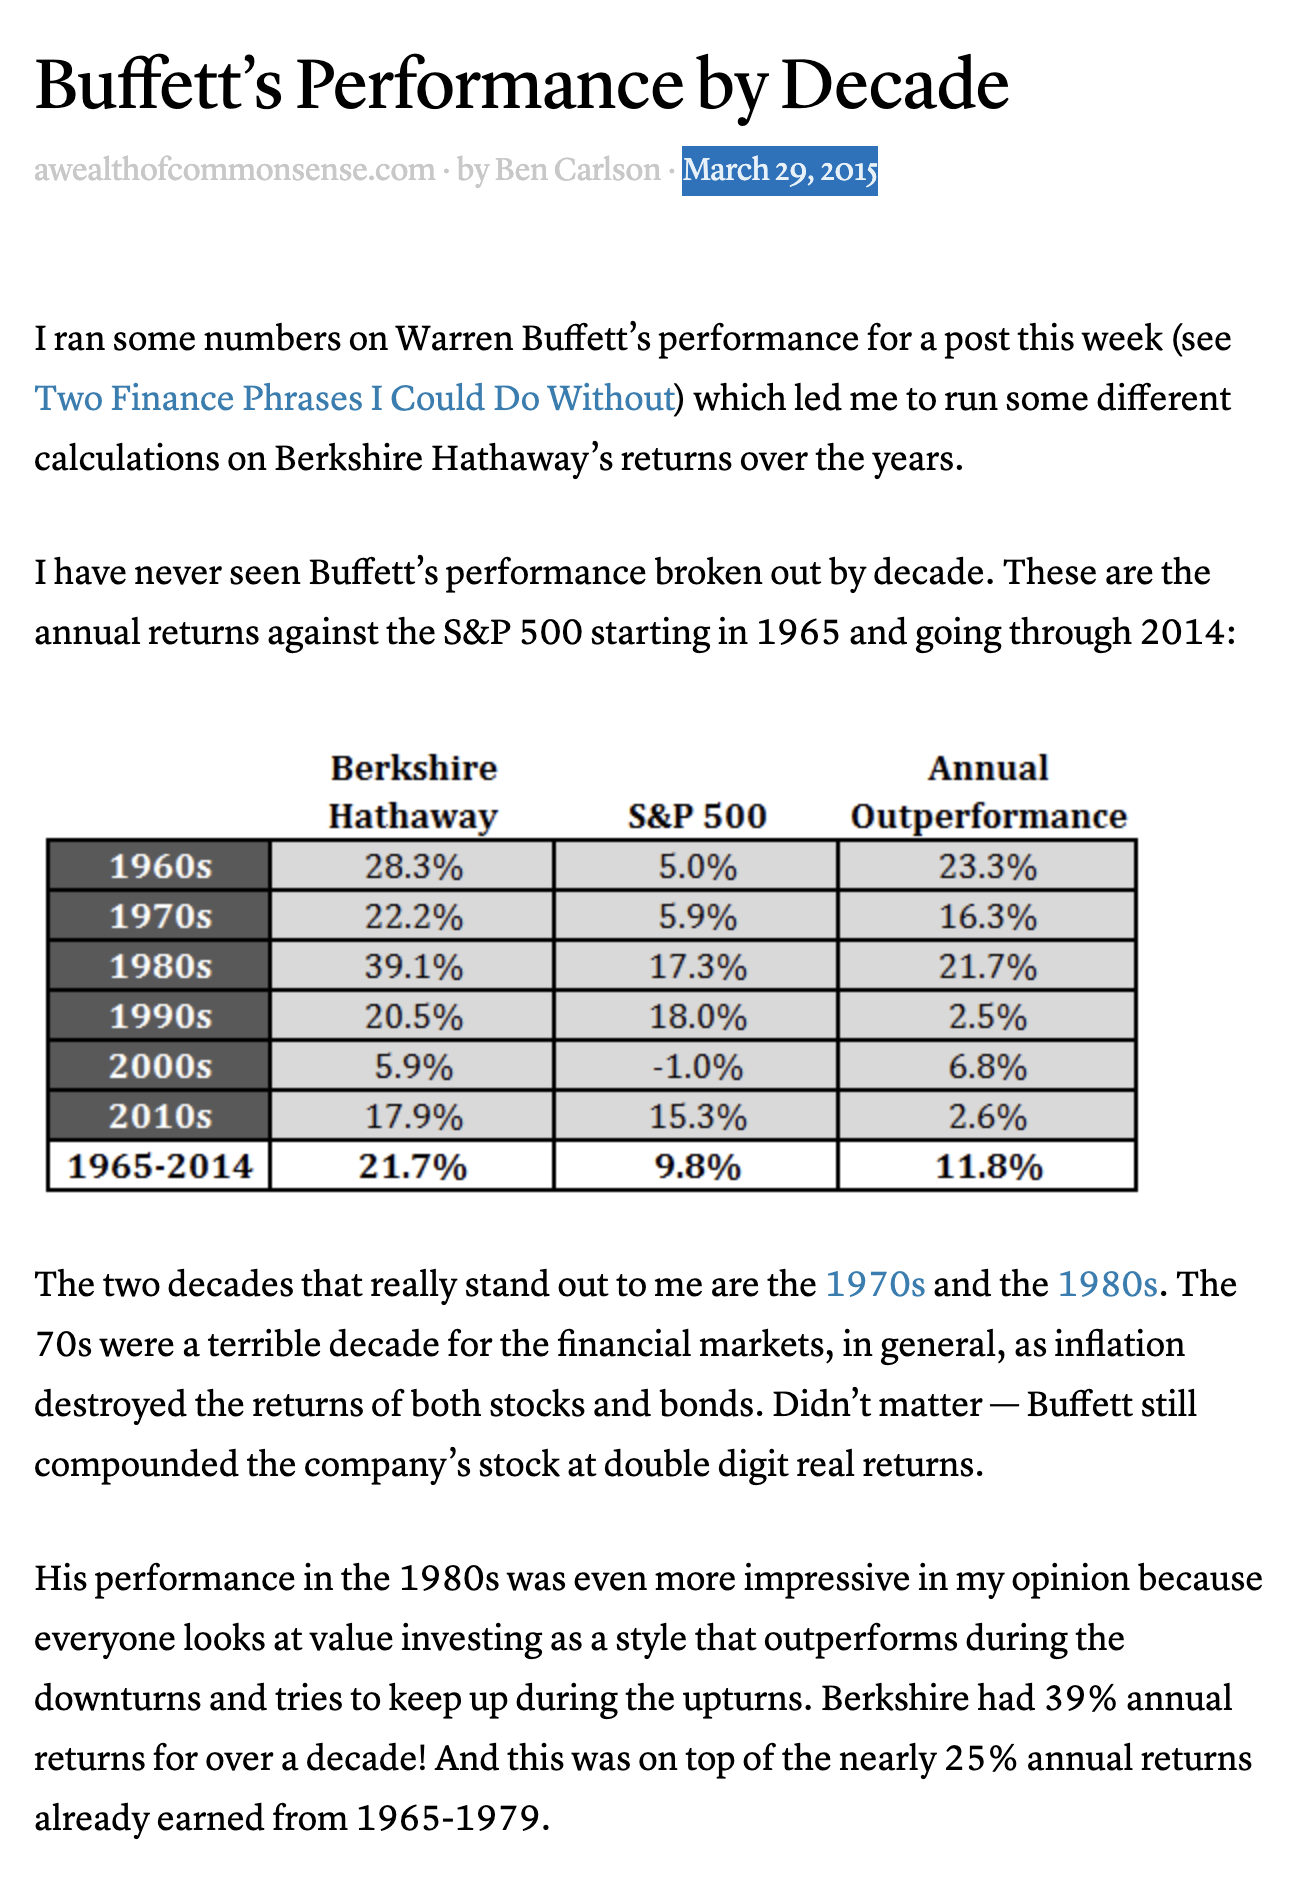
This article from 2015 shows Buffett’s decreasing outperformance since the 1990s tech booms.
And hopefully we don’t see commodities skyrocket in price resulting in 12% inflation in the US.
How can we prevent commodity prices from skyrocketing in a post-COVID world? Well, let’s take a look at how/why things settled down after the 1970s.
Federal Reserve Chairman Paul Volcker and the 1980s
Paul Volcker served two terms as the Chairman of the Federal Reserve under U.S. presidents Jimmy Carter and Ronald Reagan from August 1979 to August 1987. After a dollar collapse into 1979, the dollar surged in the early 1980s as the U.S. aggressively hiked interest rates to bring inflation under control.
Commodities reversed their course, falling in the early 1980s, to more normalized levels. The U.S. offered investors some of the highest real interest rates in the world. As a result, international capital continued to flow into the U.S., driving up the value of the dollar. However, this capital flow continued even after the Fed reversed course and began to cut rates. After a nearly 50% rise in value against other major currencies by 1985, U.S. exports began to come under considerable pressure. After modest current account surpluses to start the decade, the current account plunged to a deficit of 3.5% of GDP, an unheard of level at that time. In one of the most significant forms of international financial coordination in the modern era, the period of dollar strength ended with the signing of the Plaza Accord, which set up the dollar’s precipitous revaluation.
The Plaza Accord was a joint–agreement signed in September 1985, at the Plaza Hotel in New York City, between France, West Germany, Japan, the United States, and the United Kingdom, to depreciate the U.S. dollar in relation to the Japanese yen and German Deutsche mark by intervening in currency markets. The U.S. dollar depreciated significantly from the time of the agreement until it was replaced by the Louvre Accord in 1987. Its main aim was to provide an increased competitiveness of American and European exports, in relation to Japanese exports, by forcing through currency control.
US Dollar – 1971 to 2021
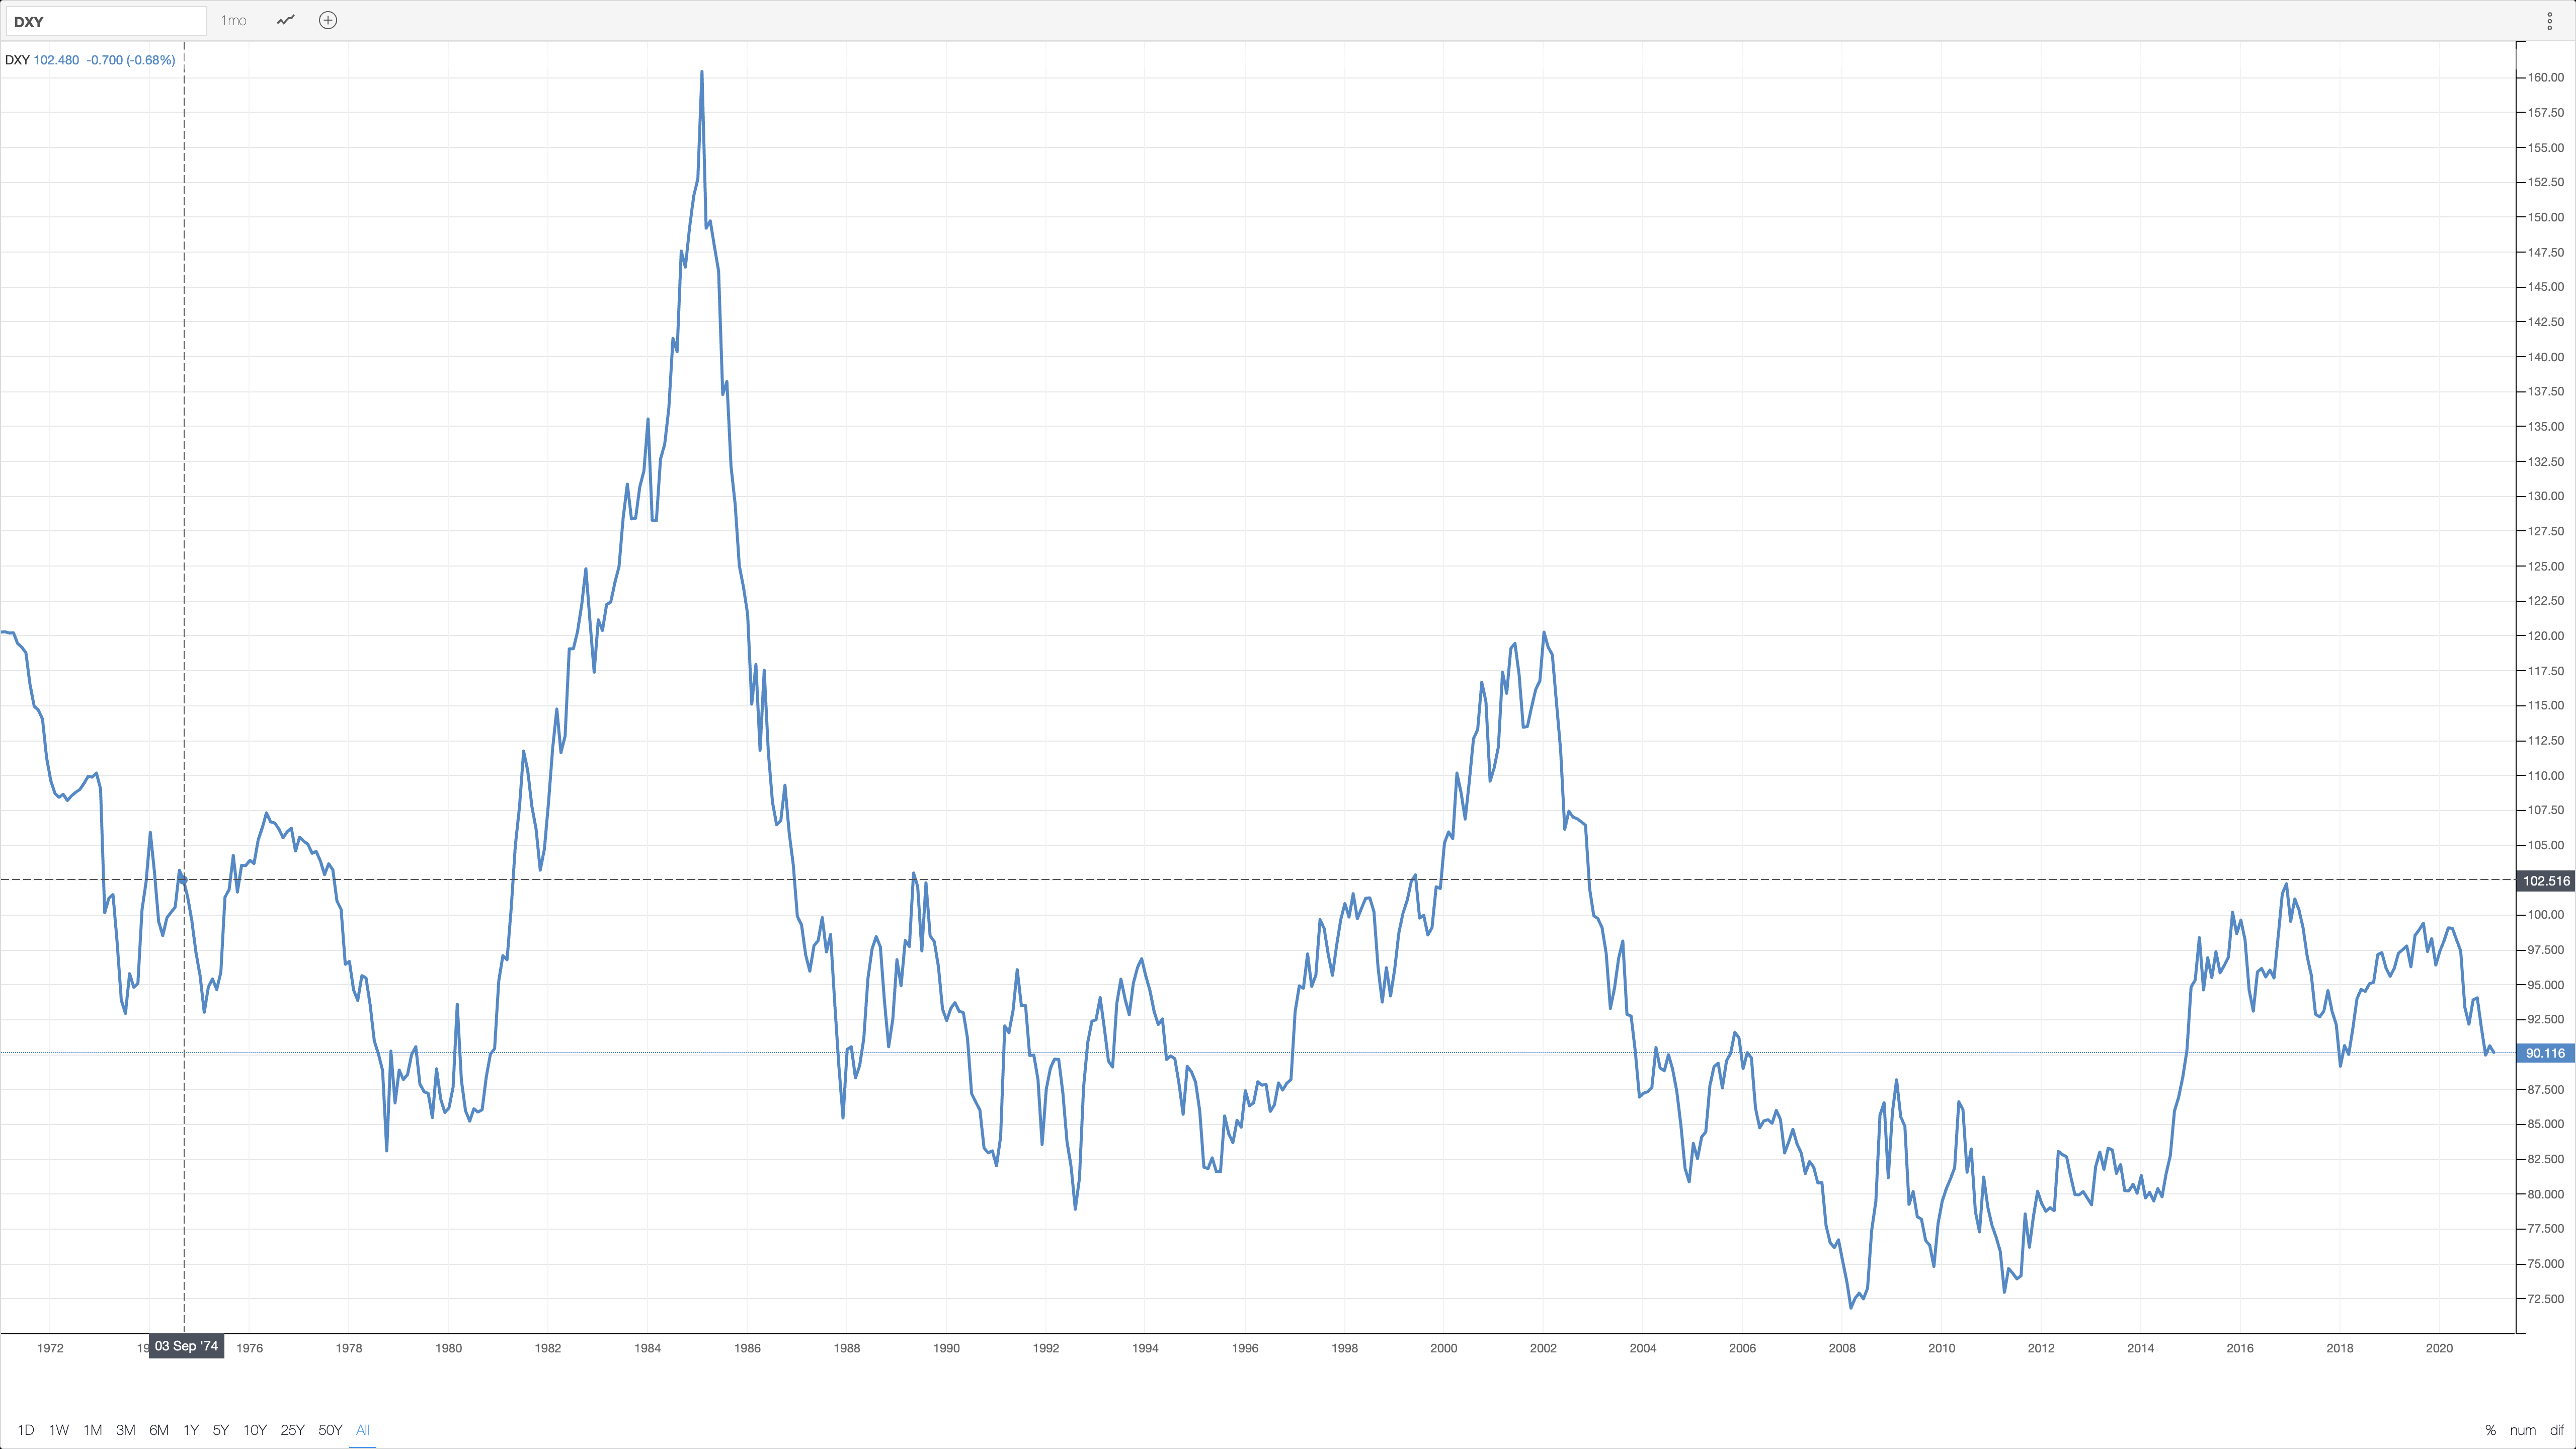
The signing of the Plaza Accord had a profound effect on Japan, as it led to the Japanese asset price bubble of the late 1980s. This was the catalyst which ultimately led to the Lost Decade starting in the early 1990s, whose effects are still heavily felt in modern Japan.
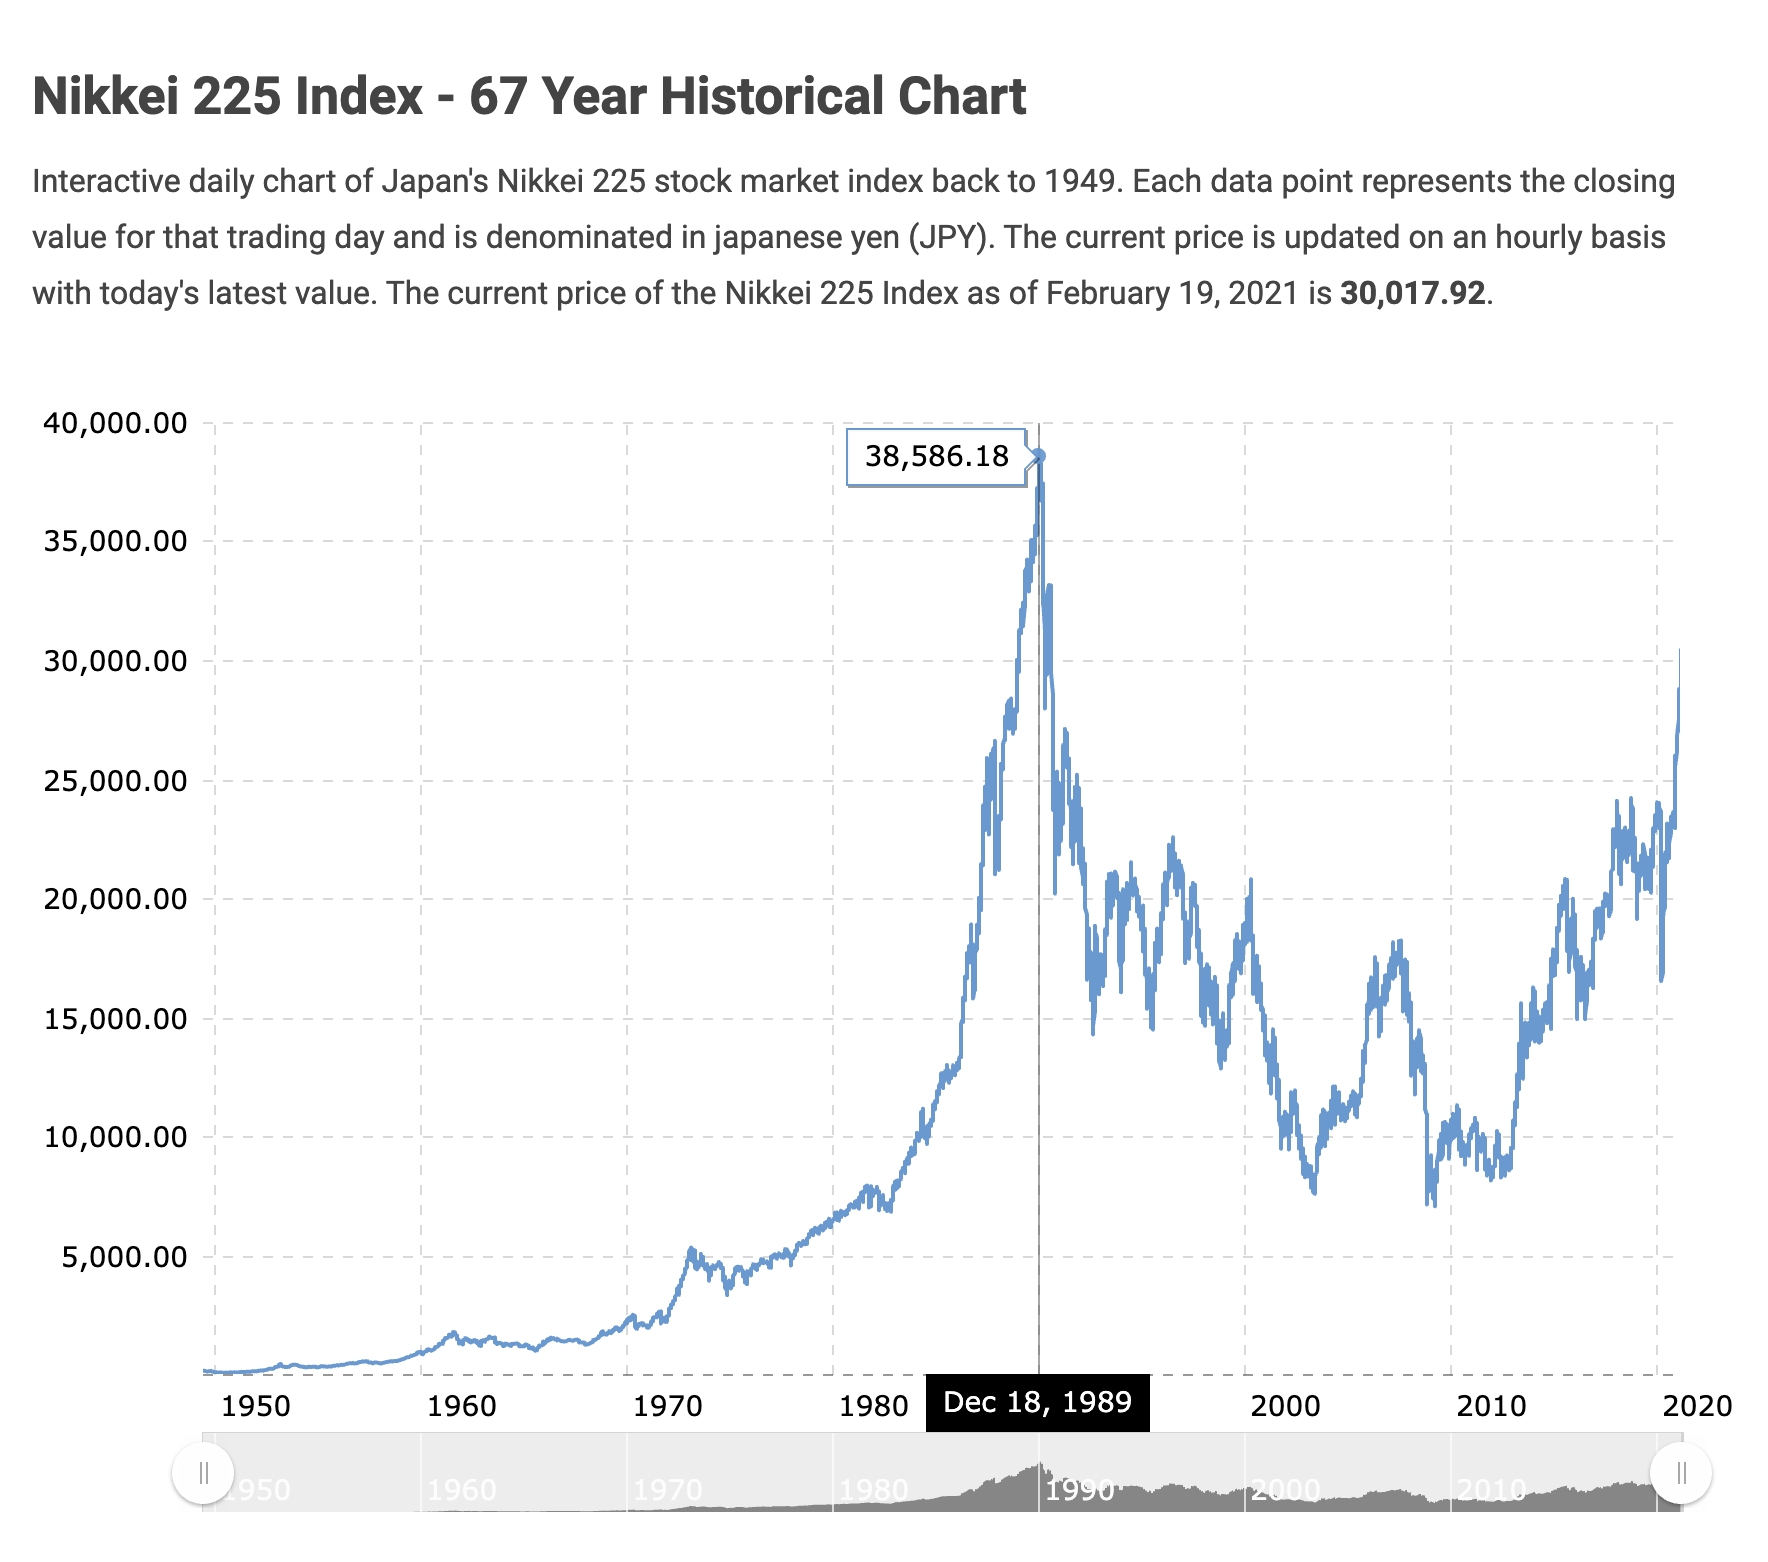
FWIW, Buffett has been buying Japanese value stocks the past few years. Buffett spent about $6 billion taking 5% stakes in five Japanese companies including Sumitomo, whose roots date back 430 years.
- Mitsubishi Corp. (MSBHF)
- finance, banking, energy, machinery, chemicals, and food
- Mitsui & Co. (MITSY)
- energy, machinery, chemicals, food, textile, logistics, finance
- Sumitomo Corp. (SSUMY)
- metals, transportation, construction, infrastructure, minerals, energy
- Itochu Corp. (ITOCY)
- domestic trading, import/export, and overseas trading of various products such as textile, machinery, metals, minerals, energy, chemicals, foods, etc
- Marubeni Corp. (MARUY)
- integrated trading and investment business conglomerate that handles products and provides services in a broad range of sectors