There will be a lot of conversations about why prices are going up or down… in the end it’s simply supply and demand. More buyers than sellers makes the price go up. More sellers than buyers makes the price go down. Either people want more of it or they don’t. (Paraphrased from Josh Brown)
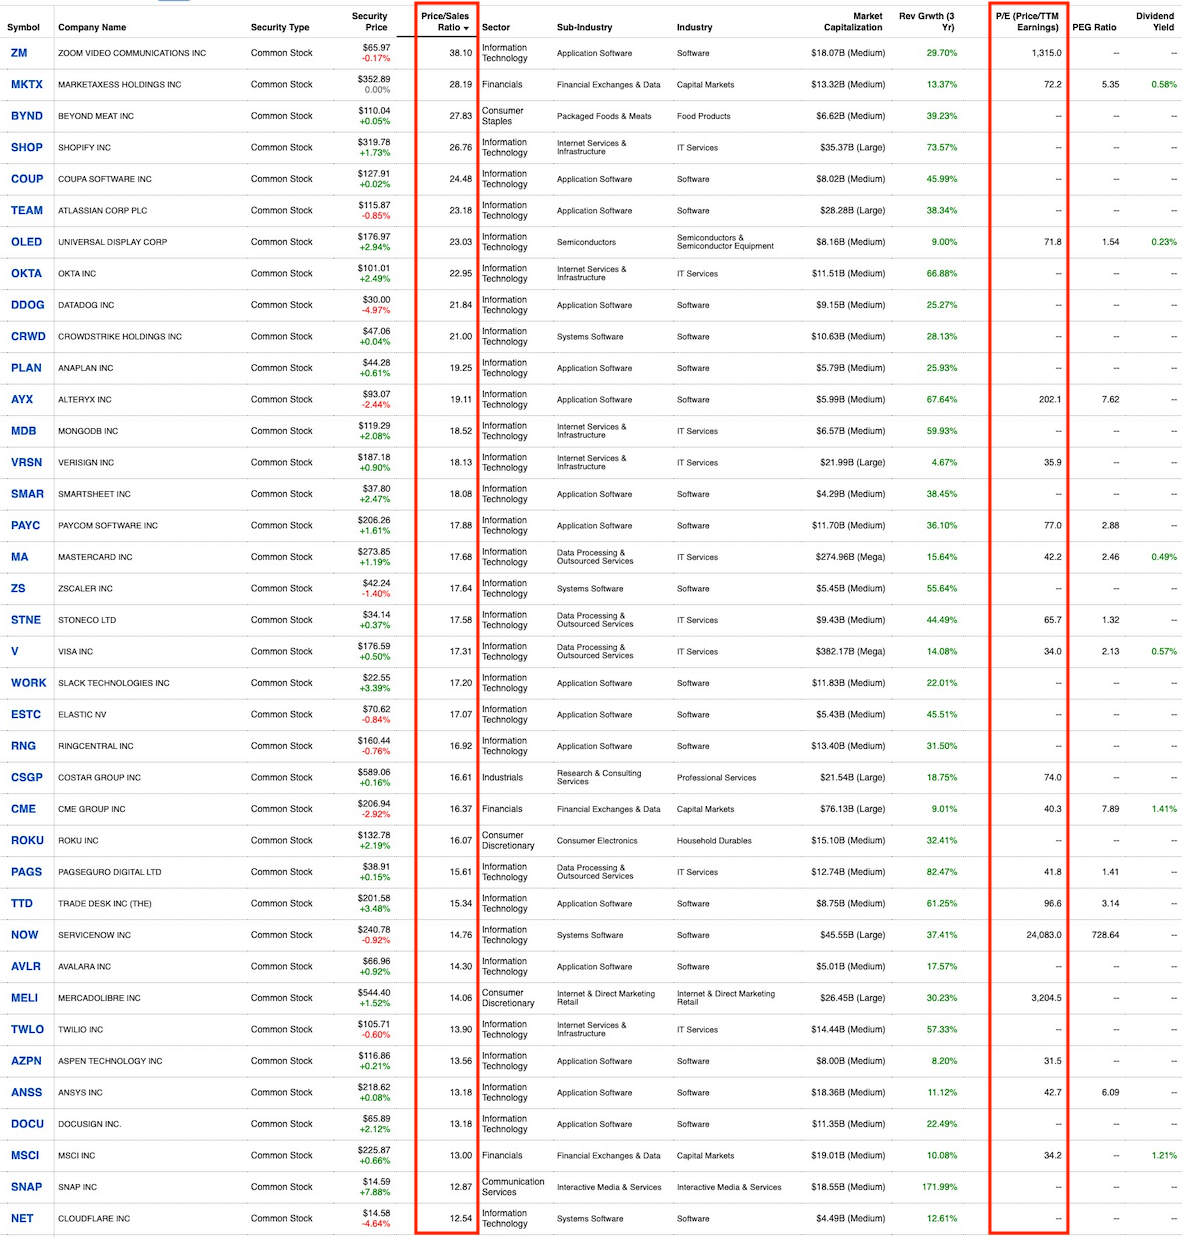
Fidelity.com has a great stock screener tool. Run a quick screen of medium to large companies ($3.5 billion+ market cap), filter for industries such as Consumer Staples, Financials, Information Technology, Communication Services, Industrials, then sort by Price/Sales Ratio and you’ll see there are a bunch of Information Technology companies selling for over 10x sales (see the Oct 2019 screener results below). Scott McNealy, co-founder of computer company Sun Microsystems had this to say about companies selling for 10x sales during the Dot Com bubble:
Scott McNealy via Bloomberg · April 1, 2002: [source]
“Two years ago [Sun Microsystems stock in the year 2000] was selling at 10 times revenues when we were at $64.
At 10 times revenues, to give you a 10-year payback, I have to pay you 100% of revenues for 10 straight years in dividends.
That assumes I can get that by my shareholders.
That assumes I have zero cost of goods sold, which is very hard for a computer company.
That assumes zero expenses, which is really hard with 39,000 employees.
That assumes I pay no taxes, which is very hard.
That assumes you pay no taxes on your dividends, which is kind of illegal.
That assumes with zero R&D for the next 10 years, I can maintain the current revenue run rate.Now, having done that, would any of you like to buy my stock at $64?
Do you realize how ridiculous those basic assumptions are?
You don’t need any transparency.
You don’t need any footnotes.
What were you thinking?”
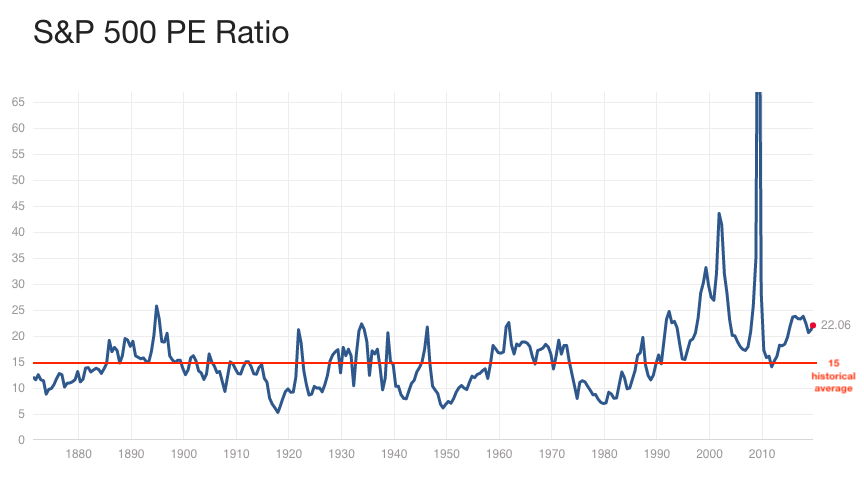
P/E Ratio
The price-to-earnings ratio indicates the dollar amount an investor can expect to invest in a company in order to receive one dollar of that company’s earnings. This is why the P/E is sometimes referred to as the price multiple because it shows how much investors are willing to pay per dollar of earnings
The historical average P/E for companies in the S&P 500 is ~15x
(Right now we’re around 22x, about 45% above average)
Example: If you pay $100 for $10 of earnings that is a 10x Price to Earnings
——
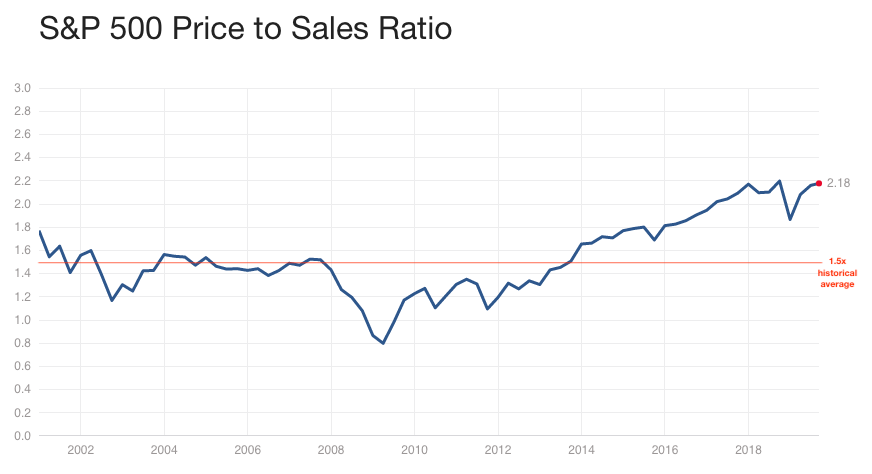
P/S Ratio
The price-to-sales ratio (Price/Sales or P/S) is a company’s market capitalization (the number of outstanding shares multiplied by the share price) divided by the company’s total sales or revenue over the past 12 months (TTM means “trailing twelve months”).
The historical average P/S for companies in the S&P 500 is ~1.5x
(Right now we’re around 2.1x, about 40% above average)
You use the P/S Ratio when a company doesn’t make money. (i.e there are no “earnings” or net income). Trusting that they one day will make money. ¯\_(ツ)_/¯
——
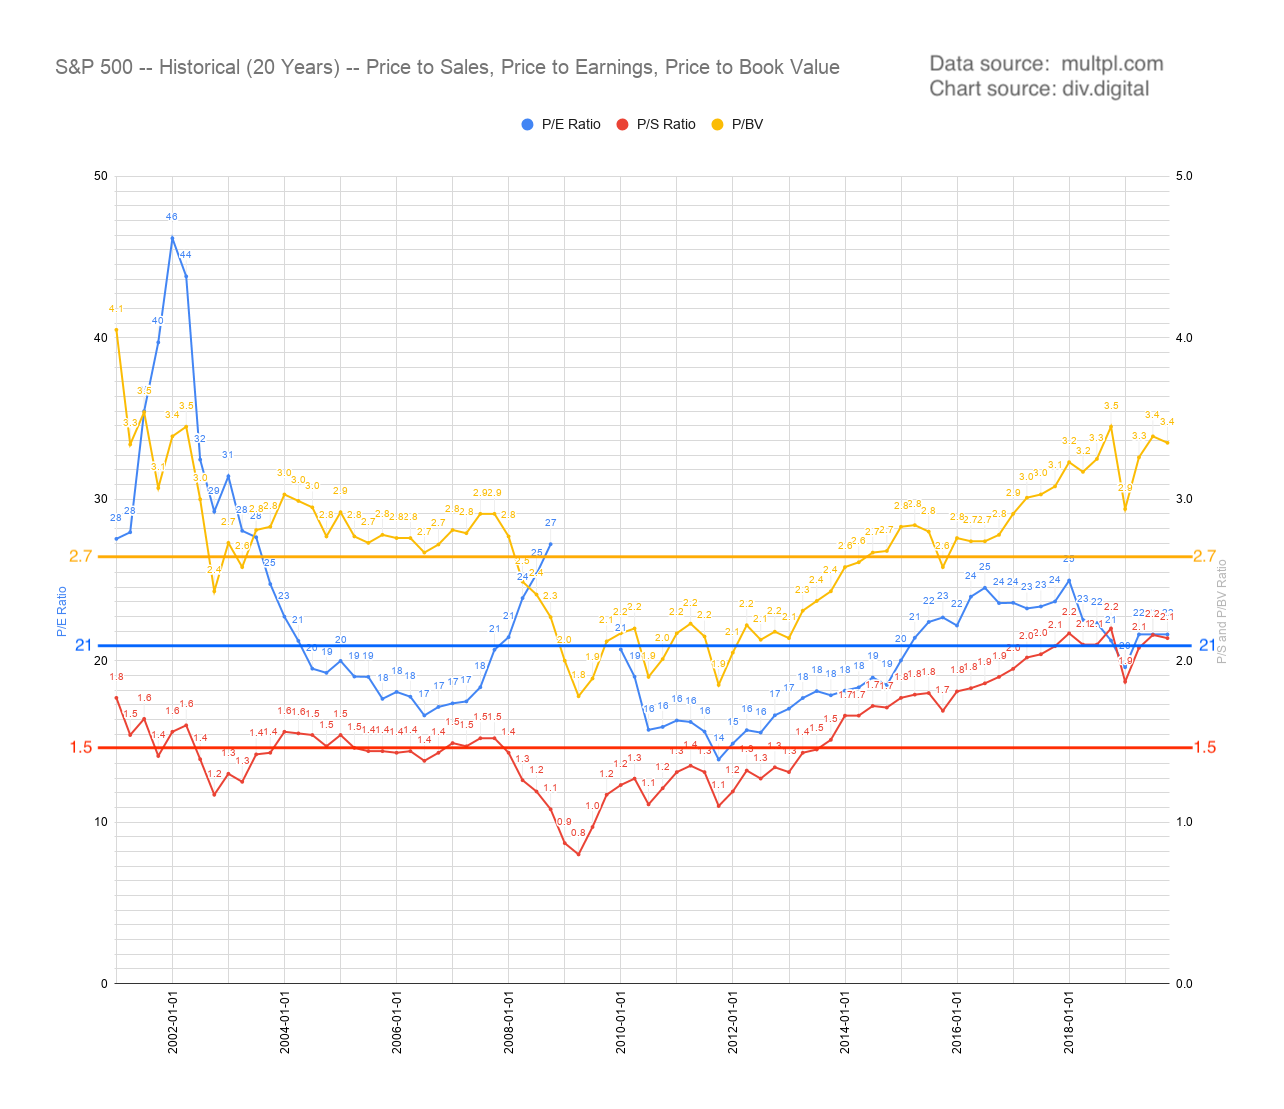
P/B or P/BV Ratio
The price-to-book ratio (Price/Sales or P/S) is calculated by dividing a company’s stock price by its book value per share, which is defined as its total assets minus any liabilities.
The historical average P/B for companies in the S&P 500 is ~2.7x
(Right now we’re around 3.4x, about 25% above average)
——
All 3 Ratios in a single chart
——
Fidelity Stock Screener, Oct 2019
——
A good peek into how companies become overvalued:
https://www.buzzfeednews.com/article/nitashatiku/how-wework-convinced-investors-its-worth-billions